Presentations
Make a deck
A deck is a set of slides in your workspace theme, on one page size: widescreen 16:9 unless you choose another (standard 4:3, A4 landscape or portrait, or a phone story; see Resize a deck). Every chart, tile and table on them stays bound to its data, so a deck you make once keeps showing current figures. This page covers the ways to start one and the editor you build it in; Bind numbers to data covers the figures themselves.
The Presentations home
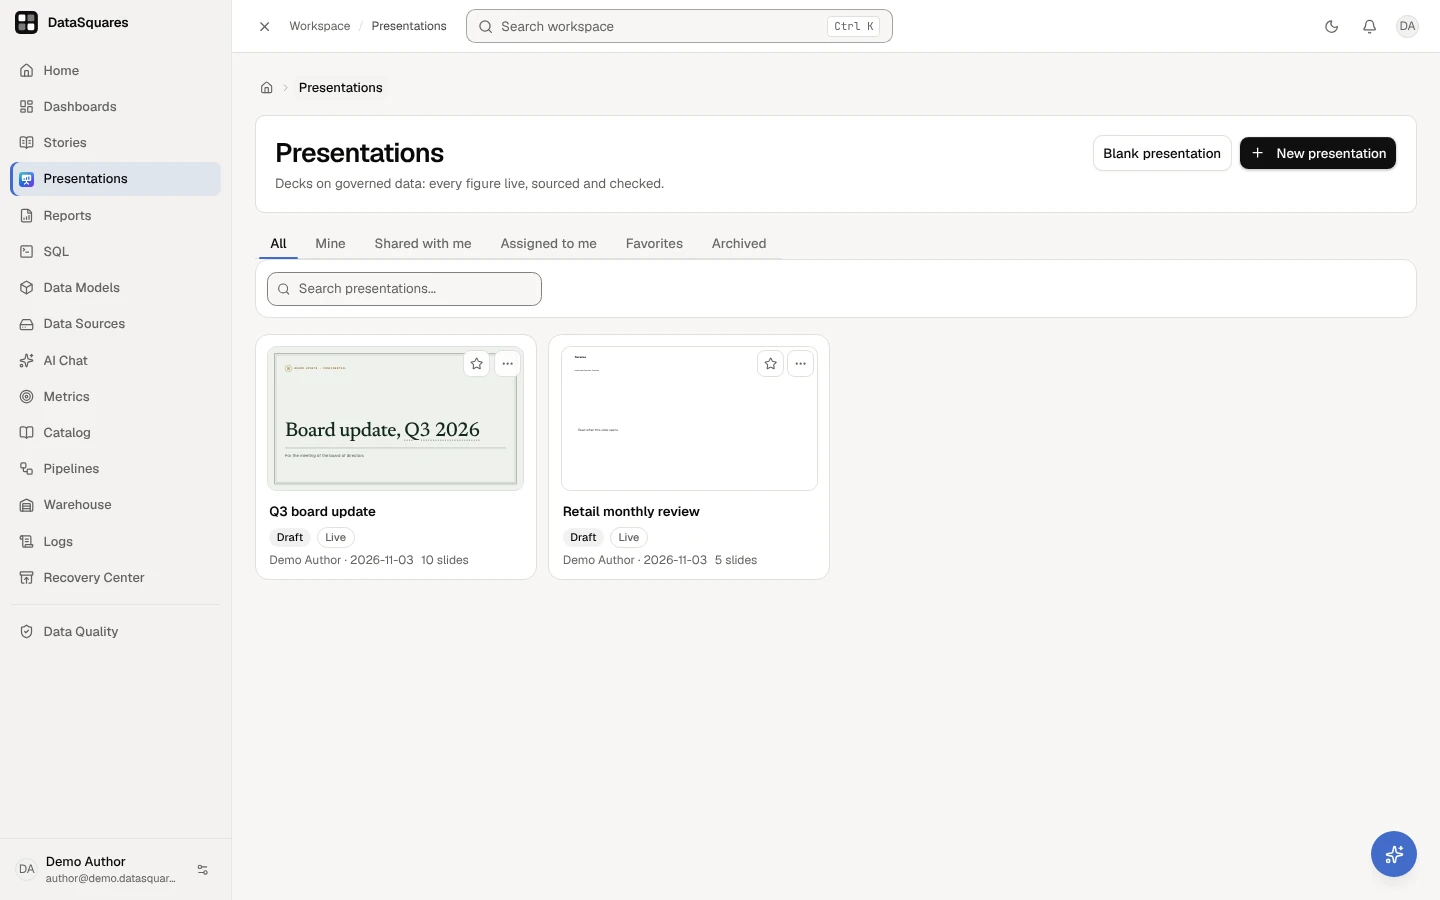
Section titled “The Presentations home”Presentations lists the decks you can open, with the tabs All, Mine, Shared with me, Assigned to me, Favorites and Archived, and a search box. Each card shows the first slide, the deck’s status (Draft, Published · version 4, Archived), Live, what the published version’s checks found (2 to fix, 1 to review or Checks passed), when it was last presented, how old its data is (Data through 2026-10-23) and how many slides are given to you. A deck that has never been published, or is archived, is listed only to its owner, admins and the people it is shared with as contributors or editors: its figures have not passed the checks yet.
A card’s first slide is the first one you can see (hidden slides skipped), drawn in the deck’s own style, master and page size; a portrait page sits centred in the card. It is a picture only: no figure is read for it, so a KPI, chart or table shows the state it has before its figures are read. Where the slide can’t be drawn, the card shows the deck’s title.
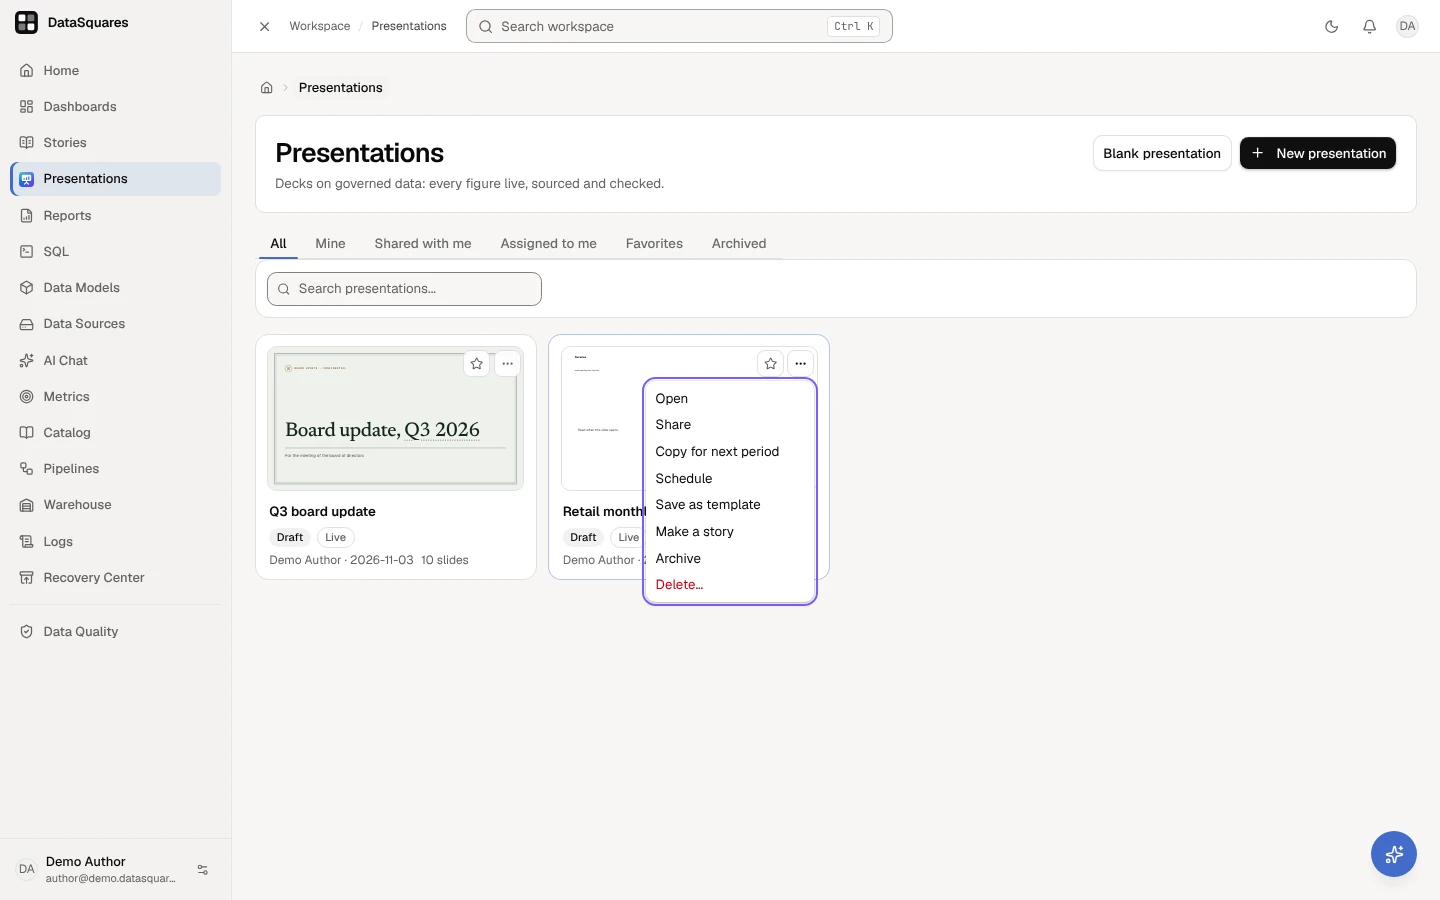
The ⋯ menu on a card holds, as your role allows: Open, Share, Copy for next period, Schedule, Save as template (its editors), Make a story, which turns it into a story (see Turn a deck into a story and back), Archive (or Restore on an archived deck) and Delete…. An archived deck is restored before it can be copied or scheduled. The star keeps it in Favorites.
Open Presentations: the tabs All, Mine, Shared with me, Assigned to me, Favorites and Archived, and a card for each deck with its first slide, its status, Live, its owner, its date and how many slides it has. Blank presentation and New presentation are at the top right.
A card’s ⋯ menu: Open, Share, Copy for next period, Schedule, Save as template, Make a story, Archive and Delete…, as your role allows.
Start a deck
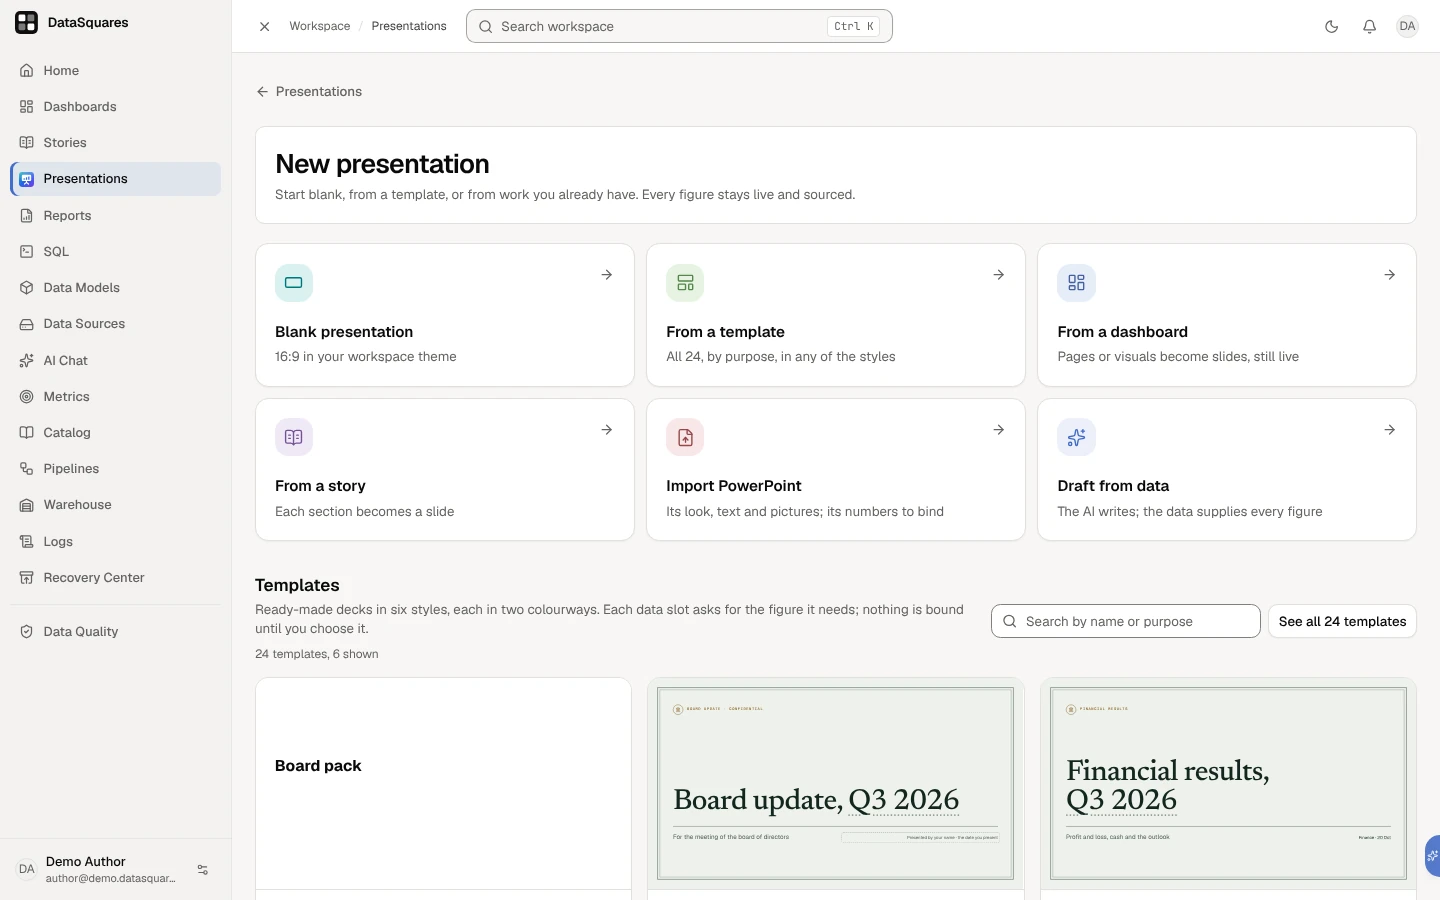
Section titled “Start a deck”New presentation opens a page with every way to start a deck, each one a card: Blank presentation first, then From a template, From a dashboard, From a story, Import PowerPoint and Draft from data. The templates are on the same page, under the cards: search them, open one to see its slides, or choose See all for the whole gallery. Escape takes you back to the page you came from, or to the list when you opened the page from a link.
Blank presentation, beside New presentation on the home, makes a blank deck in one click, in the Meridian style, its first slide on the title layout with its placeholders waiting to be written. People whose role can’t create presentations see only the decks shared with them.
New presentation opens a page of every way to start: Blank presentation, From a template, From a dashboard, From a story, Import PowerPoint and Draft from data, with the templates under them.
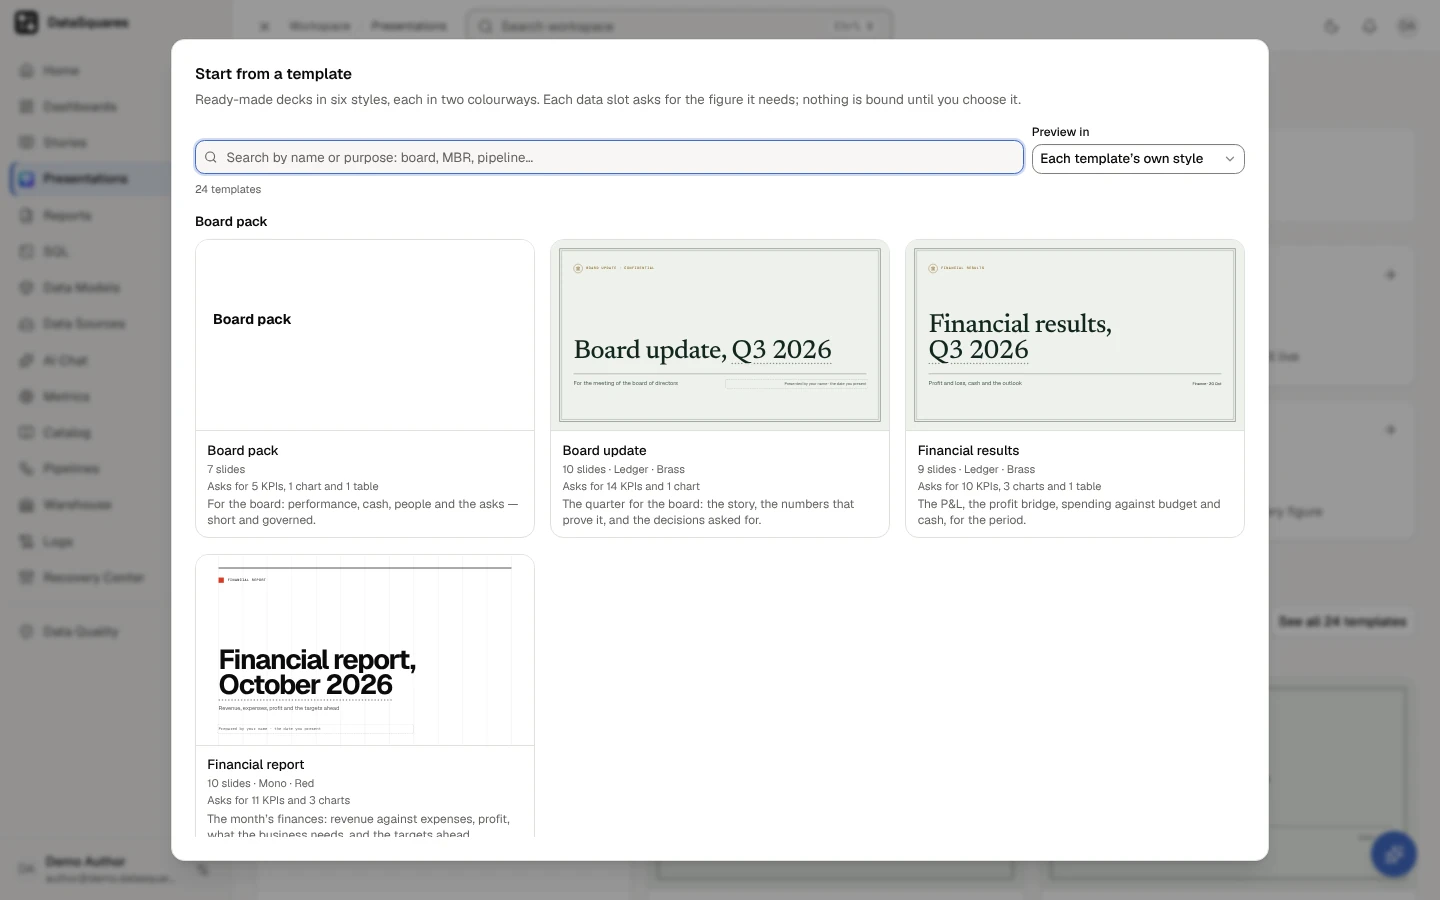
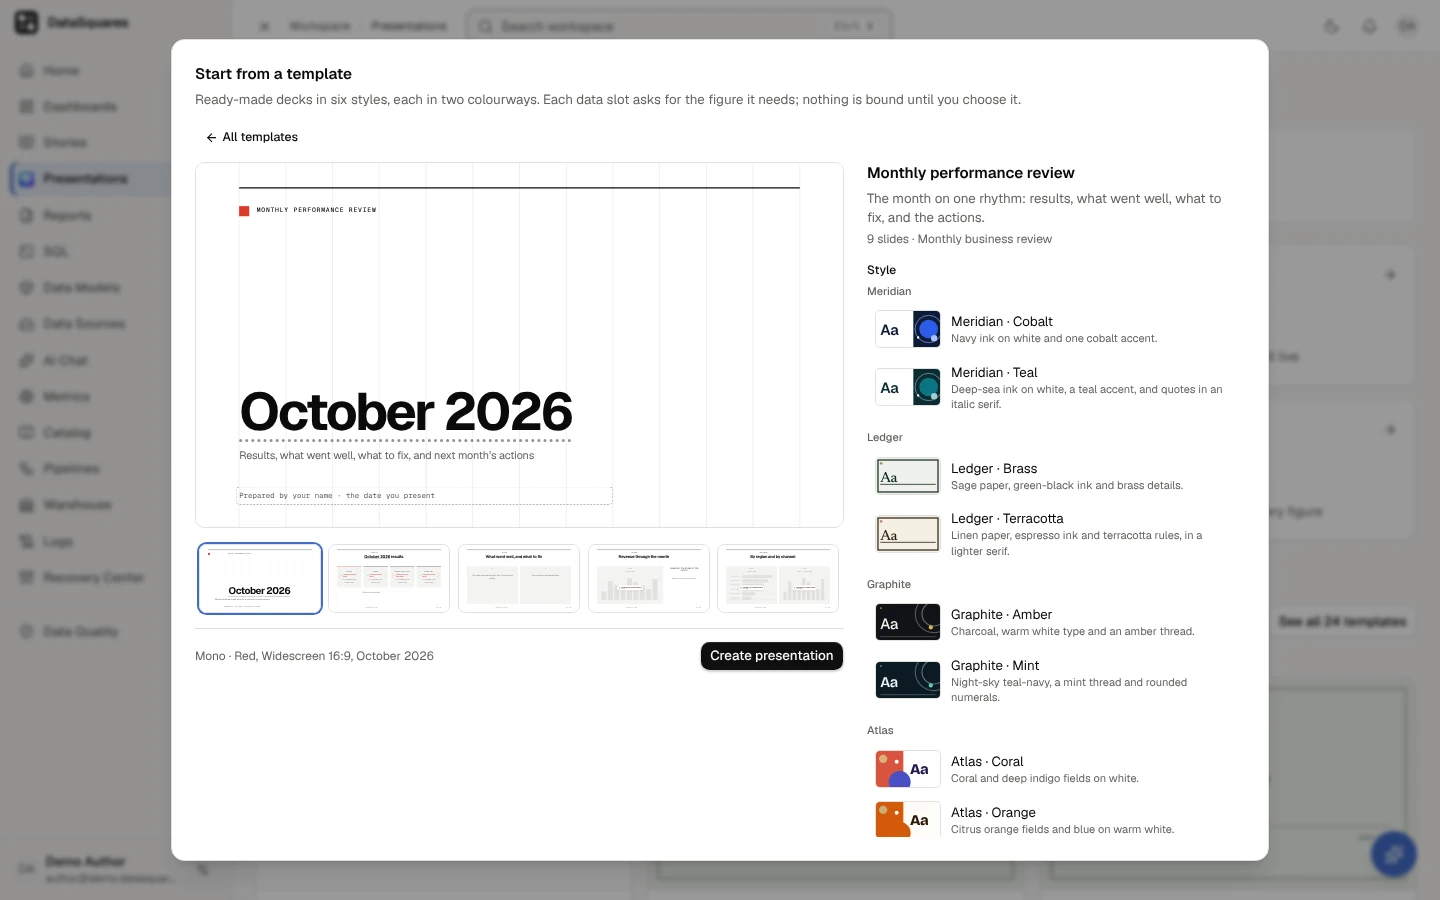
Start from a template lists the templates by purpose. Search templates finds one by name or purpose; Preview in draws every cover in one of the six styles.
Choose a template to see its slides, what each asks for, the period and the page size, then Create presentation.
Draft from data
Section titled “Draft from data”Choose Draft from data to have the AI draft the deck from metrics, a dashboard, a story or a question: the outline first, which you edit, then the slides, every figure on them a live number from your data. Each step shows its AI credits before it runs. See Draft from data.
From a dashboard
Section titled “From a dashboard”Choose From a dashboard (on a first visit, Turn a dashboard into slides on the home) and pick a dashboard you can open, or choose Turn into slides in a dashboard’s More menu. Then choose how it becomes slides:
- Split pages at row boundaries — each dashboard page becomes slides cut where no card crosses, so a card is never split. A card taller than a slide gets a slide of its own, scaled to fit.
- One slide per visual — each chart, KPI and table gets a slide of its own.
The preview shows every slide, the count, and what was not brought in (Not brought in: 1 picture). Every chart arrives bound and live, drawn as its dashboard draws it; nothing is copied as a picture. Give the presentation a title and choose Create with the slide count. To change a chart in the deck afterwards, select it and choose Make it an editable chart.
A deck holds 200 slides at most. A dashboard that would make more is refused before anything is created, with the ways to make fewer: start from one of its pages, or split pages at row boundaries instead of a slide per visual.
From a template
Section titled “From a template”From a template, or See all under the templates on the start page, opens Start from a template: ready-made decks, grouped by what they are for, with the templates people in your workspace saved last, under Your workspace’s templates. Each card shows the template’s cover drawn as it will look, with what it asks for (each data slot’s ask and each prompt, never a figure), its slide count, its style and the data it asks for: Asks for 7 KPIs, 4 charts and 1 table.
| Purpose | Templates |
|---|---|
| Board pack | Board update (the quarter for the board: the story, the numbers, the decisions asked for), Financial results (the P&L, the profit bridge, spending against budget, cash), Financial report (the month’s finances: revenue against expenses, profit, what the business needs, and the targets ahead), Board pack |
| Quarterly review | Quarterly business review (how the quarter went, what moved it, what the team needs next), Customer quarterly review (for one customer: what you achieved together, how they use you, next steps), Quarterly business report (the quarter as a report: the summary, performance, projects, growth, a financial dashboard, the team, and the challenges ahead) |
| Monthly business review | Monthly performance review (results, what went well, what to fix, the actions), Monthly business review (the month against plan, function by function, with the risks and the decisions it needs), Business review |
| Pipeline | Pipeline and forecast (where the pipeline stands, what will close, the deals that need help), Sales forecast and priorities (the year’s sales forecast and how to reach it: targets, growth drivers, priority segments, the strategy and the activity it takes) |
| Marketing | Marketing performance (leads, cost and pipeline by channel, the campaigns that worked), Project proposal (a proposal from the why to the budget: objectives, approach, timeline, risks, and how success is measured), Brand guidelines (how the brand looks and speaks: values, logo, colours, type, visual style and where it appears, drawn in the brand kit’s own colours and fonts) |
| Investor update | Investor update (growth, efficiency and the plan) |
| Product | Product and growth metrics (active users, activation, retention by cohort, adoption), Product review (what shipped against the plan, how it landed with customers, quality, and what you build next) |
| Operations | Operations review (service, cost and throughput for the month, with the fixes in flight), Incident review, Weekly KPI update |
| Company and people | Year in review (the year’s headline number and the moments that mattered), People and culture report (headcount, hiring, attrition, engagement), Annual report (the year in review as an annual report: highlights, who we are, performance, our people, what we delivered, the financials, and next year’s vision) |
Board pack, Business review, Incident review and Weekly KPI update are four older templates, the deck versions of Stories’ own. They keep the look they were made in.
Search templates finds a template as you type, by its name, what it says it covers or its purpose, including the short names people use (MBR, QBR); the number found is said beside it, and Clear the search (or Esc) shows every template again. Preview in draws every template’s cover in one of the six styles, in either colourway (each in its own by default), and Use your brand kit, offered where your workspace’s brand kit changes a look, draws them with the kit’s colours and fonts over that style. Templates that keep their own look are drawn in it. While your company locks the brand’s colours or fonts, every template is drawn as the deck will be made, in what is locked (see the brand and your deck). On a phone the cards and the controls stack in one column.
Choose a template to open it: its slides in order, each with what it asks for (choose one in the row beneath to see it larger), the data slots it holds, slide by slide, and Create presentation. It opens in the style and with the brand kit chosen in the gallery. Page size draws its slides laid out again for another size (its own is marked), and the deck is made on that size: see Resize a deck. All templates goes back to the list.
Styles
Section titled “Styles”Each of the twenty templates above can be made in any of six styles, each in two colourways, and opens in its own. A style is its layouts, shapes and type (the same covers, section breaks and big numbers); its two colourways draw it in their own colours, so a deck moves between them without anything changing place:
| Style | What it is like | Colourways |
|---|---|---|
| Meridian | Clean corporate: crisp cards, a geometric cover and generous white space | Cobalt (navy ink, one cobalt accent) · Teal (deep-sea ink, a teal accent, quotes in an italic serif) |
| Ledger | Banknote precision: a framed cover, ruled pages, outlined cards and a stately reading serif | Brass (sage paper, green-black ink) · Terracotta (linen paper, espresso ink, a lighter serif) |
| Graphite (dark) | Dark and executive: deep surfaces, warm white type, a thin thread of colour and big numerals | Amber (charcoal) · Mint (night-sky teal-navy, rounded numerals) |
| Atlas | Bold colour blocks: full-bleed fields, circles and oversized grotesque type | Coral (coral and deep indigo on white) · Orange (citrus orange and blue on warm white) |
| Mono | Swiss and exact: a visible grid, one signal colour and flush-left numbers | Red (black on white) · Indigo (cool slate, monospace numbers) |
| Bloom | Warm and human: a soft serif, arches and rounded panels | Wine (blush paper) · Violet (lavender paper, deep plum ink, a lighter serif) |
A colourway is named with its style, Meridian · Teal. (Until October 2026 the second colourways had names of their own: Harbor, Linen, Aurora, Citrus, Slate and Orchid.) In October 2026 some colours of the styles changed so that no series reads as good or bad news. Styles are drawn live, so the change reaches existing decks, their published versions, link views and new exports too: the good and bad colours a step deeper (lighter in Graphite · Amber and Graphite · Mint), the series kept as they were but for a few ochres a hair deeper to read at 3:1 on their cards (Meridian · Cobalt series 4, Ledger · Brass 5, Atlas · Coral 4, Bloom · Wine 2), and Atlas · Orange’s section disc and number now blue. A red colourway keeps its red series and a green one its green, clear of the bad and good colours; a change always carries its arrow and sign. No series changed place. The release note lists each. Under Style they are listed by style, each style with what it is like, each colourway with its colours and a small picture of its cover in its own colours and type; the arrow keys, Home and End move through them. Choose one to see the whole deck laid out in it before you make it; the slides stay on screen while the new style is drawn. Create presentation makes the deck in the style chosen. You can change it later in the editor’s Style (on the rail), under Style and brand kit: every element and binding stays. A template that keeps its own look (the four older ones, and your workspace’s) shows Its own look instead, or, while your company locks the brand’s colours or fonts, the style it will be made in with your brand kit.
Your brand kit
Section titled “Your brand kit”Where your workspace’s brand kit changes a look, Use your brand kit above the styles draws the template with the kit’s colours and fonts over the style chosen, wherever they read, and Create presentation makes the deck so: it wears the brand, its headings in the kit’s heading font and the rest in its body font. A kit colour that would make slide text hard to read, or data colours a reader with red–green colour blindness can’t tell apart, is left out in that style, as few as can be, and the style’s own is drawn there. The deck keeps the brand as it took it: a change to the kit later changes no deck by itself (see the brand and your deck). While your company locks the brand’s colours or fonts, every deck made wears what is locked, whether the switch is on or off, and the preview shows it so: the switch adds the rest of the kit. A template that keeps its own look is made in its style in the brand, or in Meridian · Cobalt in the brand when it is in none of the six styles (under the font lock alone, a template in a theme that is not one of the six styles keeps its colours and takes the brand’s fonts), and says so.
The period
Section titled “The period”Each template suggests the period its kind of review covers now, in your workspace’s time zone: the last complete quarter for a quarterly one, the last complete month for a monthly one, the quarter under way for Pipeline and forecast, this month for Project proposal, this year for Year in review, Sales forecast and priorities and Brand guidelines, and the last complete year for Annual report. Under Period, the suggested one comes first and is chosen; the period after it and those before it (two years of quarters, a year of months, four years) follow, newest first. The slides are previewed for the period chosen, in any style, and Create presentation makes the deck for it.
Every period on its slides (a title such as Q3 2026 results, a comparison with the quarter before), every KPI its data slots ask for and every chart or table whose words name a period is written for the deck’s period. Copy for next period makes next period’s deck with each period moved on by one of its own: a quarter to the next quarter, a month to the next month, a year to the next year, a day to the next day. A window of several of the deck’s periods moves by one of the deck’s period instead and keeps its length, so its words and its data still match: a quarterly deck’s Revenue by month, Jan–Sep 2026 becomes Apr–Dec 2026, and a monthly deck’s twelve months to October become the twelve months to November. So a period of another kind than the deck’s moves by its own on every copy: on a monthly deck a quarter becomes the next quarter and a year the next year. A chart or table whose words name no period reads the last complete quarter, which rolls on by itself: the copy leaves it as it is. Templates that keep their own look name no period, so they offer none.
Keep a period as it is
Section titled “Keep a period as it is”A period that should stay put, such as a baseline year 2024, can be kept. The Copy for next period dialog lists under What moves every period that moves, each with Keep as it is: choose it and the preview is read again with that period staying, its figures, period tokens and title words with it. A kept period is listed as 2024 kept as it is, with Let it move to move it again. When you keep the deck’s own period, the period most of the others read becomes the deck’s period. You can’t keep every period: the copy would have nothing to move, so the last one that moves has no Keep as it is.
The deck remembers what you kept, and so does the copy, so every copy made after keeps it too: the dialog opens with it kept, until someone lets it move. A deck that keeps nothing is copied as it always was.
What is remembered is each figure you kept, not the period on its own. Say a quarterly deck shows actual for 2025 and plan for 2026, and you keep 2026: on the copy, actual has moved on to 2026 too, but the next copy still moves it on to 2027 and then 2028, while plan stays at 2026. The dialog then lists 2026 twice, as a period that moves and as one kept, each with its own button. A kept figure whose period you change by hand is no longer kept; a kept data slot stays kept when you choose its data, as the figure it becomes.
If everything a deck keeps is all it has left to move (the quarter’s figures were made to roll forward, say, so only the kept baseline is fixed), the dialog says every period is kept and offers Let it move on each; let one move and the copy can be made. Each change to what a deck keeps is recorded in the Audit log, with who made the copy and what was kept before and after: each period kept, in how many places, and each figure.
Data slots
Section titled “Data slots”Where a template shows a figure, a KPI tile, a chart or a table, the new deck has a data slot: a dashed space that says what it asks for, such as Choose your revenue metric, and what the figure will be (a KPI’s comparison and period, a chart’s kind, a table’s top rows). A slot never holds a figure: nothing in a template is bound to data until you choose it, so no deck starts with a number nobody chose.
To fill a slot, choose its ask (or select it and press Enter, or choose Choose data on its quick bar or in the Figure tab) and pick a metric from your workspace’s metrics, certified ones first:
- a KPI slot is filled the moment you pick the metric, reading the deck’s period and comparing as the template set it;
- a chart or table slot also asks what it is Broken down by (a field of the metric’s model), and asks for the kind of chart only where the template chose none. A metric read from a saved query can’t be broken down, which the picker says. Where its title or subtitle names a window (Revenue by month, Jan–Sep 2026, Top accounts by revenue, Q3 2026, year to date, at month end), the chart or table reads that window for the deck’s period, and a copy for the next period moves it on as it moves every period (a window of several periods by one of the deck’s period); of Q3 2026 vs Q3 2025 it reads the period shown, and of a bridge from Q2 2026 to Q3 2026 the quarter it ends in. A chart drawn by quarter or by month names the quarters or months it shows, never one alone. One whose words name no window reads the last complete quarter, and a copy leaves it as it is.
The slot becomes the tile, chart or table in its place, bound to the metric you chose, and every reader sees it computed with their own access. Undo turns it back into the slot.
Under each slot you may fill, Suggested lists the workspace’s metrics that match what it asks for, as you may read them: certified ones first, then those named the same, by a synonym or by your glossary, and those in another unit marked as such. Choosing one fills the slot (or opens its picker on that metric, where it still needs a field to break it down by). Each suggestion is one click to confirm; nothing ever binds on its own.
A slot not filled yet is the editor’s alone: presenting, exports and a deck’s thumbnails draw nothing in its place. So is a prompt: text a template leaves for you to write, such as Prepared by your name · the date you present, shows in grey in the editor until you type. The template gallery shows both, so you see what a deck will need before you make it.
The sources slide
Section titled “The sources slide”Most templates end, just before their closing slide, with Sources and definitions (all but Year in review, Customer quarterly review, Project proposal, Quarterly business report, Sales forecast and priorities, Brand guidelines, Annual report and Financial report): a slide that lists every figure in the deck, with its source and version, its period, how recent its data is, and whether it is certified; figures entered by hand are listed as such. It fills itself from the deck as it stands, so there is nothing to type (the editor says so if you try), and it leaves out the figures on hidden slides, as presenting and exports do. Every reader sees it filled with the figures they may see.
The list keeps its own text size. When a deck has more figures than the slide holds, it continues on as many pages as it needs, each with the slide’s look and its title counting them: Sources and definitions (2 of 3). The stage shows the first page and, beneath it, the pages after it; presenting steps through them before the next slide, and the PDF and the PowerPoint file have a page for each (a PNG of the slide is its first page).
Your own templates
Section titled “Your own templates”To make your own, open a deck’s ⋯ menu on the home and choose Save as template: its slides, speaker notes and bindings as they are now, for anyone in the workspace to start from; data slots not filled yet stay slots. Its maker or an admin can remove it with Remove template.
The brand and your deck
Section titled “The brand and your deck”When your company locks its brand kit’s fonts, colours or logo (an admin does, under Administration → Brand kit), every deck keeps to them, and the server refuses a save that doesn’t, saying which lock and what to use instead:
- New decks wear what is locked. A blank deck, one from a template in any style, from a dashboard or from a story, one drafted by Draft from data and a copy for the next period wear the brand’s colours (under the colour lock), its fonts (under the font lock) and its logo where the master puts it (under the logo lock; a deck from a dashboard or a story, which has no theme, keeps none and shows the logo). A deck imported from PowerPoint keeps the file’s look, and shows what is off the brand, until you apply the brand.
- Colours. A colour you choose (a shape’s fill or outline, a line, an icon) is one of the theme’s colours, which wear the brand, or one of the brand’s own; you can’t type in another. A colour the deck already has stays usable, so duplicating or copying a slide made before the lock works. Text you paste comes in the brand’s nearest colours; an element you paste does too, unless the deck already has its colour in that place (a fill, an outline, text), which it keeps; either is said once (Changed to the brand’s colours). Style offers the six styles, each colourway in the brand, lists a theme that is not one of them with the reason, and can’t take the brand off.
- Fonts. The deck’s text is set in the brand’s heading and body fonts: the master’s text styles offer only those, and so does a text box’s font panel. A save that sets a text box in another font is refused, and says so; for a brand set in Lora and Inter: Your company keeps decks to its brand’s fonts: a text box can’t be set in Playfair Display. Use Lora and Inter. Nothing was saved. A text box pasted in another font is set in its style’s (Changed to the brand’s fonts). A box’s own font the deck held before the lock is kept, in a duplicated slide too, and shown as off the brand (A text box is set in Playfair Display, not in Lora and Inter.) until you apply the brand. The font lock alone never locks colours: Use your brand kit puts the brand’s colours on or takes them off, the fonts staying, and any theme may be chosen, its text styles in the brand’s fonts; no theme can’t (it would set the text in the default font).
- Logo. The master shows the brand’s logo on every slide that shows a master’s logo, a deck with no theme included: it can’t be hidden, removed or replaced, and it stays at least 48 px on its long side, wholly on the slide and clear of the footer and the slide number. Switching the theme, or to no theme, takes the logo with the deck; going back to an earlier master that hid it or showed another is refused. A logo moved, sized or hidden before the lock can always be put back (see A style’s parts).
- Editing together. A lock never closes a slide’s room or loses anyone’s work: something off the brand that still reaches the room is kept and shown as off the brand.
- Versions. Restoring a version brings back its theme, master and footer, keeping only what the locks cover: the brand’s colours (its style in them; a theme that is not one of the six styles takes Meridian · Cobalt), its fonts and its logo. The version’s slides come back as they were, and what on them is off the brand is shown.
A deck made before a lock, an imported one, or one wearing an earlier version of the brand keeps what it has; nothing changes on its own. Its editors see what is off the brand under the top bar, each with its slide, kept up to date as they edit, and Apply the brand: one change that brings in only what the locks cover. Under the colour lock it dresses the deck’s style in the brand’s colours as they are now (a theme that is not one of the six styles takes Meridian · Cobalt) and makes each colour off the brand the brand’s nearest, keeping its transparency; under the font lock it sets the text styles in the brand’s fonts and takes away a text box’s own font that isn’t the brand’s, so the box is set in its style’s (its size, weight and spacing stay; a weight that font lacks is drawn in its nearest face); under the logo lock it shows the brand’s logo where the master puts it (a deck with no theme keeps none). The draft is kept first as a version (Draft before applying the brand), and the confirmation offers Undo, which brings it back, look and all, only while nothing in the deck has changed since: once anyone has saved a slide or changed the deck, Undo says so, and you go back by restoring Draft before applying the brand from Versions (nothing anyone did since is lost). Both are recorded in the Audit log. Until then a save keeps what was there and refuses only something new off the brand.
Publish says what is off the brand, and you may publish; or, when your company blocks publishing a deck off its brand, it waits until you apply the brand.
From a PowerPoint file
Section titled “From a PowerPoint file”Import PowerPoint brings a .pptx in as a new deck in its own look, or a .potx as a template of your workspace: its layouts, text and pictures come in, its numbers come in to bind, and its charts come in as slots to bind. In the editor, a slide’s ⋯ menu in Slides offers Import PowerPoint after… to bring a file’s slides into the deck. See Import a PowerPoint file.
From a story
Section titled “From a story”From a story turns a story you can read into slides, one slide for each section you can read. Its live numbers stay live: they are bound again for slides, and the preview names any number whose format needs a look (a prefix or suffix such as $ is not carried). Its KPI tiles, charts and tables from a presentation come back as KPI tiles, charts and tables bound to the same data, beside the section’s text, and its dashboard cards as dashboard visuals; a story made from a deck comes back as the same slides (see Turn a deck into a story and back). Text the AI wrote in the story is marked AI-written on the slide. The story’s own pictures (those a deck gave it) are copied into the new deck as its own private pictures and placed on their slides; the preview says how many, and names each picture that stays out: one the story no longer keeps, a picture shown from a link, or one inside a list or a line of text.
Add to presentation
Section titled “Add to presentation”Three places send what you are looking at into a deck you choose, on a new slide at its end:
- a dashboard card’s Add to presentation… (in the card’s actions, or a chart’s right-click menu): the card comes in as itself, read through its dashboard’s own access check;
- a saved query’s Add to presentation, on Saved Queries in its row’s menu or its panel: you choose whether the slide shows it as a Chart, a Table or a KPI tile, which column is the figure and what it is broken down by, from the columns its result really has;
- an AI chat answer’s Add to presentation, offered on an answer that ran a query and has a figure to read: its query is saved once, so the slide reads it live with each reader’s access.
Only decks you can add slides to are listed. Nothing is copied as a picture and no figure is written into the deck.
The editor
Section titled “The editor”Opening a deck opens its editor, where the slide owns the screen: the app’s own menu and bar give way to one bar at the top, a rail of tools at the left, and small pills at the slide’s foot. Everything the editor does is also a command: press Ctrl+K (⌘K on a Mac), or choose Search commands or ask AI in the middle of the bar, and type its name.
-
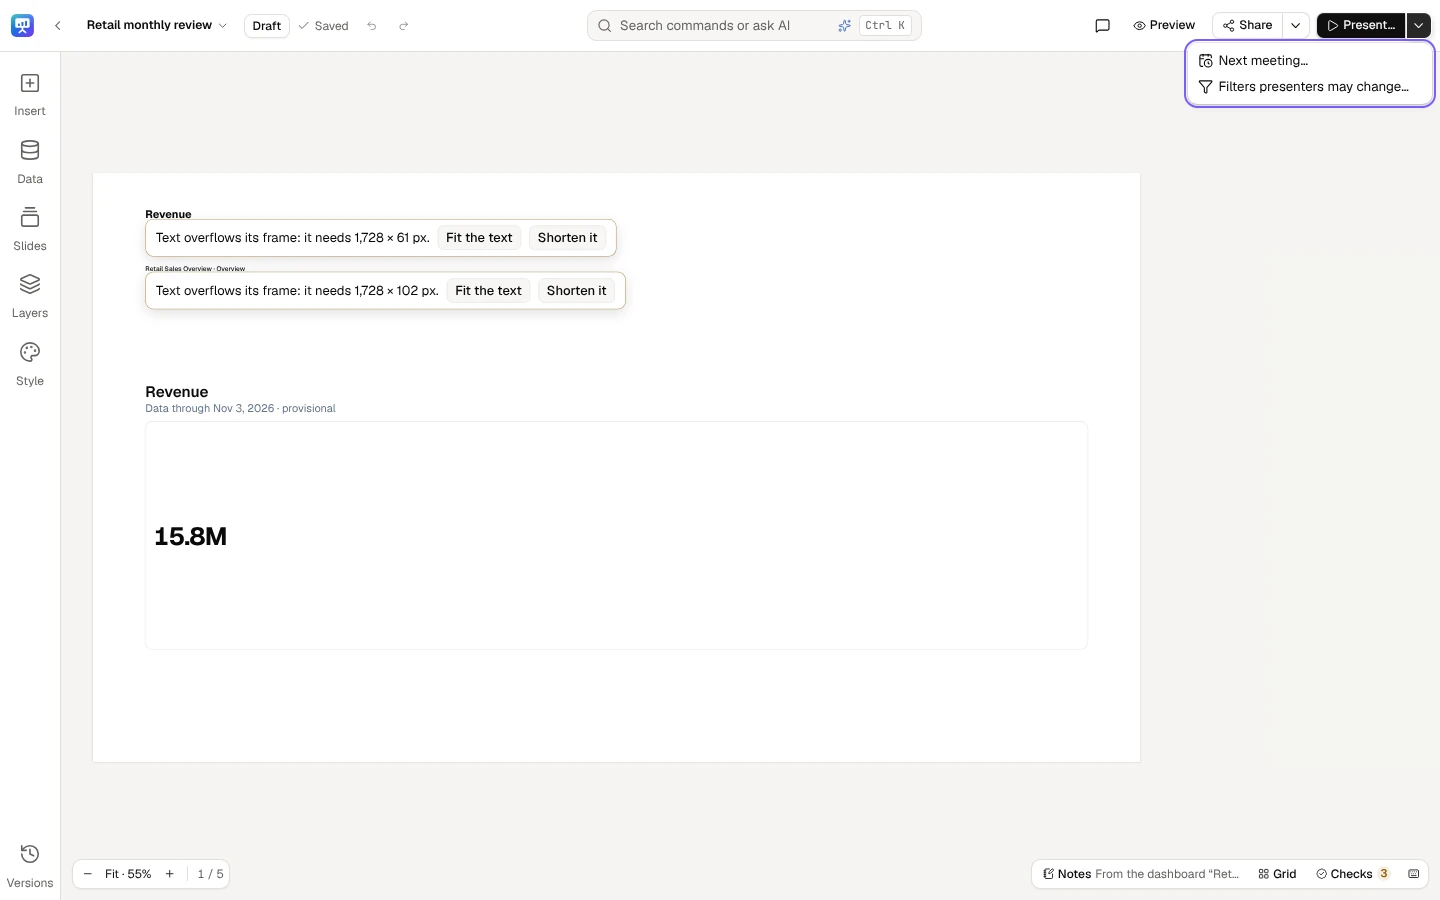
The top bar — one row of 52 px. At the left, the logo tile (the app’s menu: notifications, theme and your account are there while you edit) and the arrow Back to Presentations; the deck’s title, which holds its menu: Rename…, Page size… (see Resize a deck), Copy for next period…, Make a story… (see Turn a deck into a story and back), Archive and Delete…. Beside it, the deck’s status as one chip (Published · version 4, with a dot when the draft has moved on): select it for Edited since publishing, What changed, the next meeting and when the deck was frozen. Then the save state, and Undo and Redo. At the right: who else is in the deck and on which slide, Comments, Preview (the deck as its readers read it), Share…, whose arrow (More sharing actions) holds Publish…, Ask for review…, Readers… (once the deck is published) and Checks, then Links and embed…, Export a file… and Schedule sends…, and the primary Present…, whose arrow (More presenting actions) holds Next meeting…, Freeze for the meeting… (or Back to live…) and Filters presenters may change…. What you see depends on your role: only editors and the owner publish or ask for a review.
-
The rail — at the left, each tool with its word: Insert, Data, Slides, Layers and Style, and Versions at its foot. A tool opens its drawer, 300 px wide, over the slide’s left edge; one drawer is open at a time. A drawer folds once you have used it (an element inserted, a slide opened, a style chosen), when you choose its tool again or its Fold button, or press Esc; the keyboard goes back to its tool.
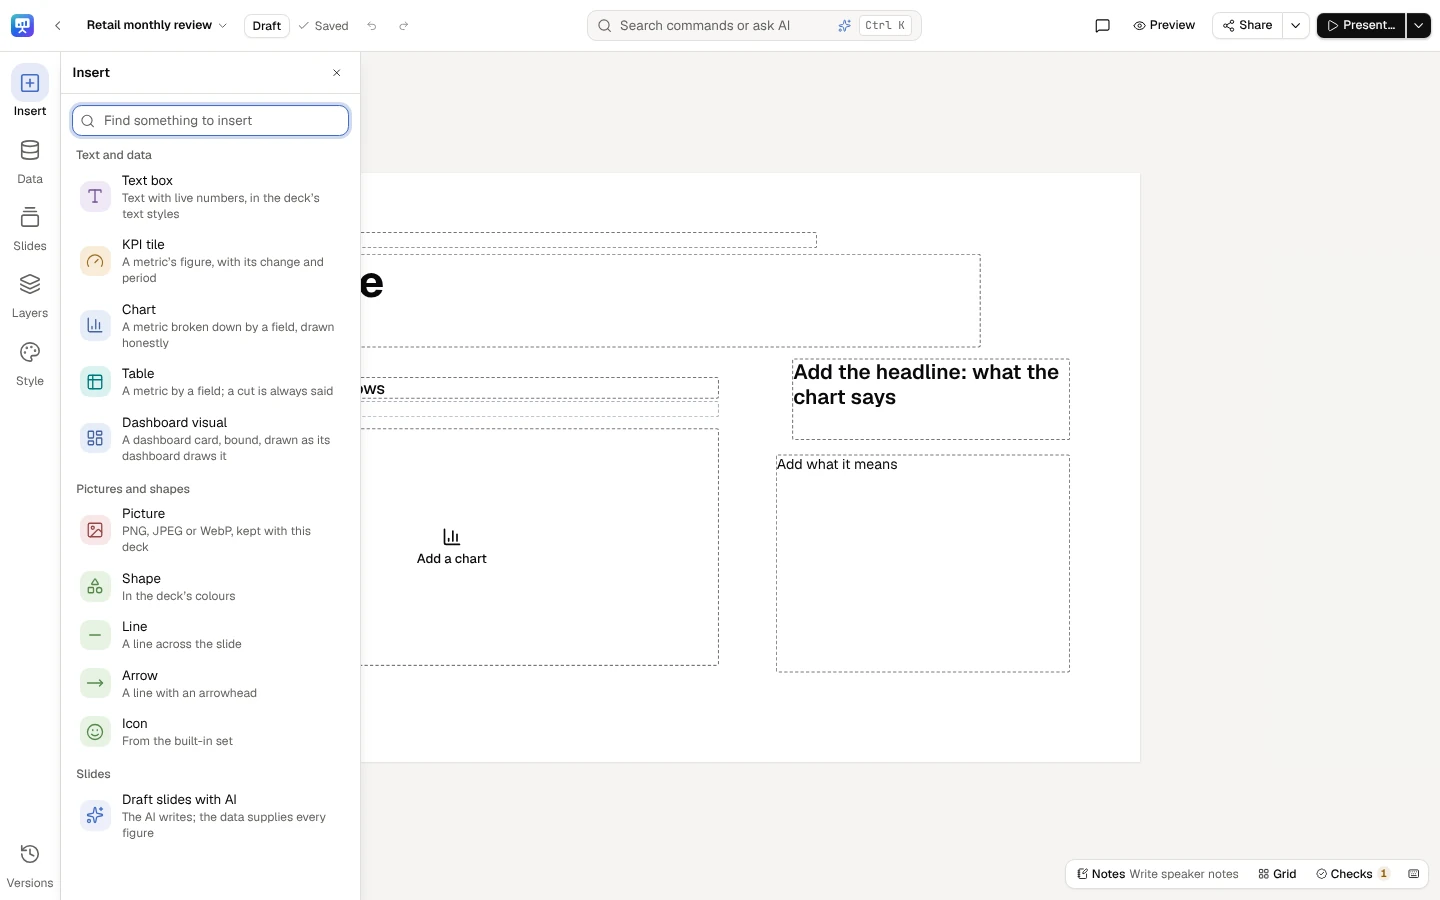
- Insert — its search first (Find something to insert), then Text box, KPI tile, Chart, Table and Dashboard visual; Picture, Shape, Line, Arrow and Icon; and Draft slides with AI (see Draft slides from your data).
- Data (the command Add data) — what figures can read: certified metrics first, then metrics, model measures, saved queries and dashboard visuals. Find a metric, model, query or dashboard narrows it; press one to put it on the slide, or drag it there.
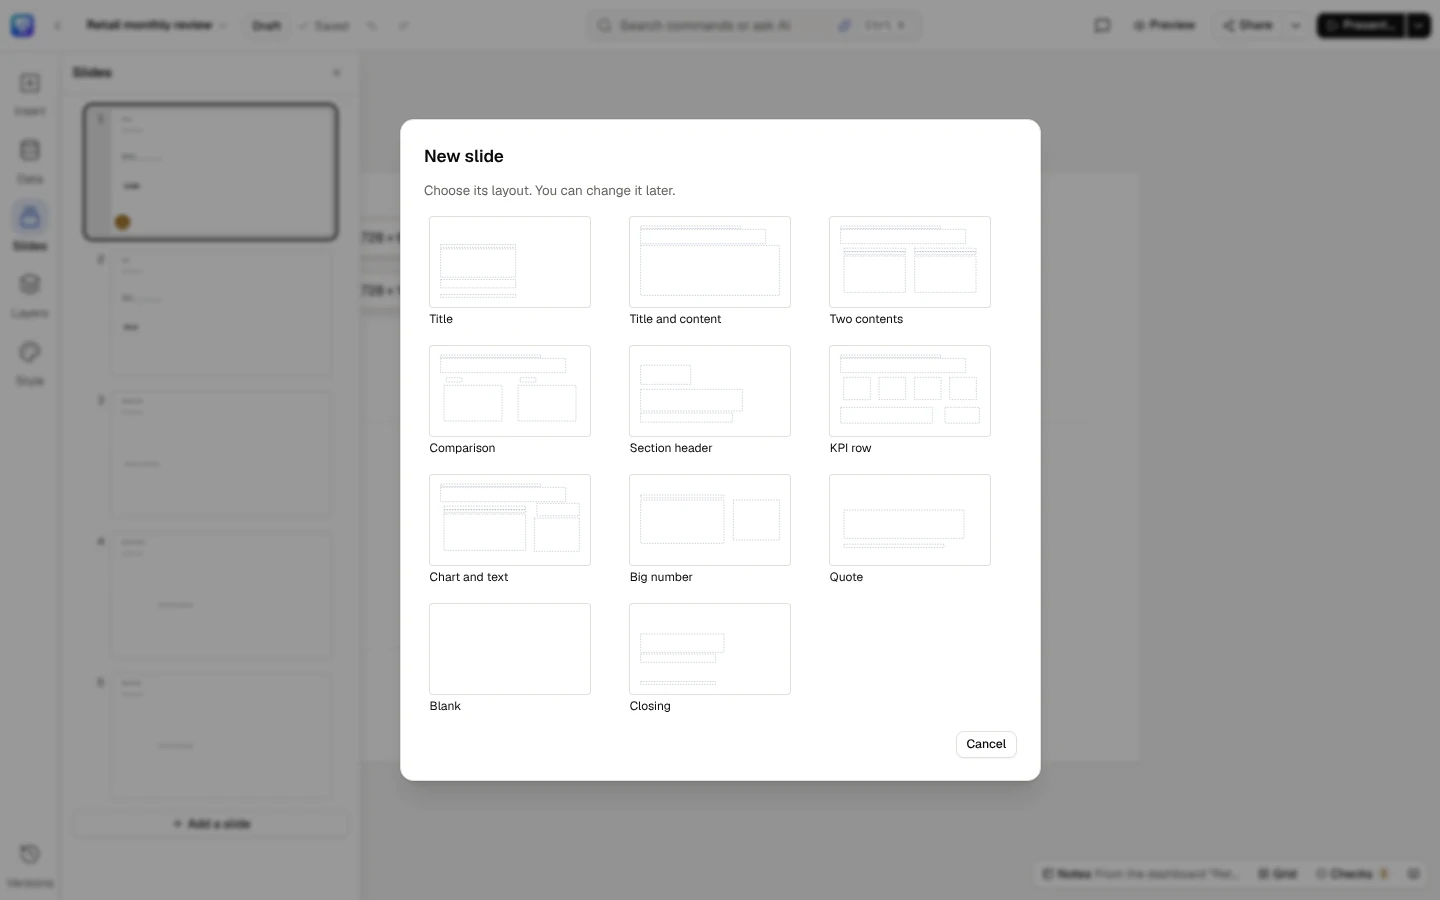
- Slides — every slide in order, with a mark on each slide that has a finding, and Add a slide. Add a slide, or New slide after in a slide’s menu, opens New slide: choose the new slide’s layout from the deck’s style (the built-in styles offer Title, Title and content, Two contents, Comparison, Section header, KPI row, Chart and text, Big number, Quote, Blank and Closing); you can change it later. Drag a slide to reorder it, or focus it and press Alt+← / Alt+→. A slide’s ⋯ menu (or Shift+F10 on it) holds New slide after, Duplicate slide, Import PowerPoint after…, Tidy slide, Suggest a headline, Write speaker notes, Hide slide (or Show slide), Start a section here and Delete slide….
- Layers — the slide’s elements in reading order, a group as a folder of its elements; Alt+↑ / Alt+↓ move one earlier or later. Folded at its foot, Style parts lists what the style draws beneath them (see A style’s parts).
- Style — Style and brand kit, This slide’s layout and Edit the master…. The deck’s style: the six styles, each with its two colourways, each colourway with its colours in words and a small picture of its cover, then the dashboards’ built-in themes and your workspace’s own. Switching keeps every element and binding; text and charts still in their places move to where the new style puts them. A theme whose slide text would read under 4.5:1 is listed with its reasons and can’t be chosen. Where your workspace’s brand kit changes a look, Use your brand kit at the top dresses the deck’s style in it, or takes it off (a deck in a theme that is not one of the styles takes Meridian · Cobalt); switching between styles keeps it on.
- Versions — the slide’s own changes, newest first (Undo to before: any of them), and Versions…, the deck’s published versions (see Publish and versions).
-
The stage — the slide being edited, on its page size’s frame (1920 × 1080 for 16:9). Elements snap to an 8 px grid and to each other, and stay on the slide.
Shift-click orCtrl-click adds an element to the selection, and a right-click opens its menu (see Select, group and right-click). -
The selection’s panel — at the right, 300 px, only while something is selected: Figure (the element’s data: its source, period, comparison and calculation) and Format. Fold the selection’s panel puts it away until the next selection. Comments and Checks open in its place. At Fit the slide is laid out in the room the panel leaves, whether it is open or not, so a click selects without the slide moving, resizing or flickering, and the panel never covers it. Zoomed in, an element the panel covers glides into view once you let go of the mouse.
-
The quick bar — over the selected element (under it where there is no room above), never over an open drawer: at most five controls: its first actions and, when it has more, More actions with the rest, each with its shortcut. Each kind of element leads with its own:
Selected First on its quick bar KPI tile Period, Figure, Number format Chart Period, Chart type, Figure Table Figure, Rows shown, Number format Text box Font (named in its own face), Text style, Text colour, Bold; Italic, Underline, Highlight and Edit text are in More actions (double-click, Enter or F2 still edit) Shape Fill colour, Outline colour Line Line colour Icon Change the icon…, Icon colour Picture Edit the picture…, Alt text Dashboard visual Figure Data slot Choose data Several elements Group, Duplicate, Lock, Delete A group Ungroup, Duplicate, Lock, Delete The style artwork, grouped Ungroup, Hide on this slide, and Reset where this slide changes a part A style part Its Fill, Colour and Outline (those it has), Group once the slide’s artwork is ungrouped, Hide on this slide, then where its change holds Format…, Duplicate and Delete follow where there is room. While you type in a text box the bar holds Text style, Text colour, Bold, Italic and Underline, and the lists, the text’s direction and Claim tied to in More actions. Alt+F10 goes to it and Esc goes back.
-
Colours and fonts — every colour and font of the deck is a tile that shows what it holds and opens the shared colour or font panel in the selection’s panel: on the quick bar, in the Format tab, in a style part’s panel and in the master’s text styles. Change all, at the panel’s foot, changes the colour or font you started from on this slide or on every slide. See Colours and fonts and A text box’s format.
-
The pills at the foot — at the left, the zoom (Zoom out, the zoom’s menu with Fit and 50 % to 200 %, Zoom in) with the slide’s place in the deck, and what is selected; in the middle, a slide just deleted with its Undo; at the right, Notes, Grid (every slide at once), Checks with what they found, and Keyboard shortcuts.
-
Speaker notes — Notes at the foot shows their first line while they are folded; choose it to open them under the slide, and again to fold them.
The keyboard reaches all of it: Tab moves from the top bar to the rail, the slide and the foot; the arrow keys move along the quick bar and along the foot’s pills; Esc folds a drawer, giving the keyboard back to its tool. Ctrl+/ lists every shortcut (see Keyboard).
The editor: the top bar (the way back, the title and its menu, the status, the save state, Undo and Redo, the search, then Comments, Preview, Share and Present…), the rail at the left (Insert, Data, Slides, Layers, Style, and Versions at its foot), and the foot (zoom, the slide number, Notes, Grid and Checks).
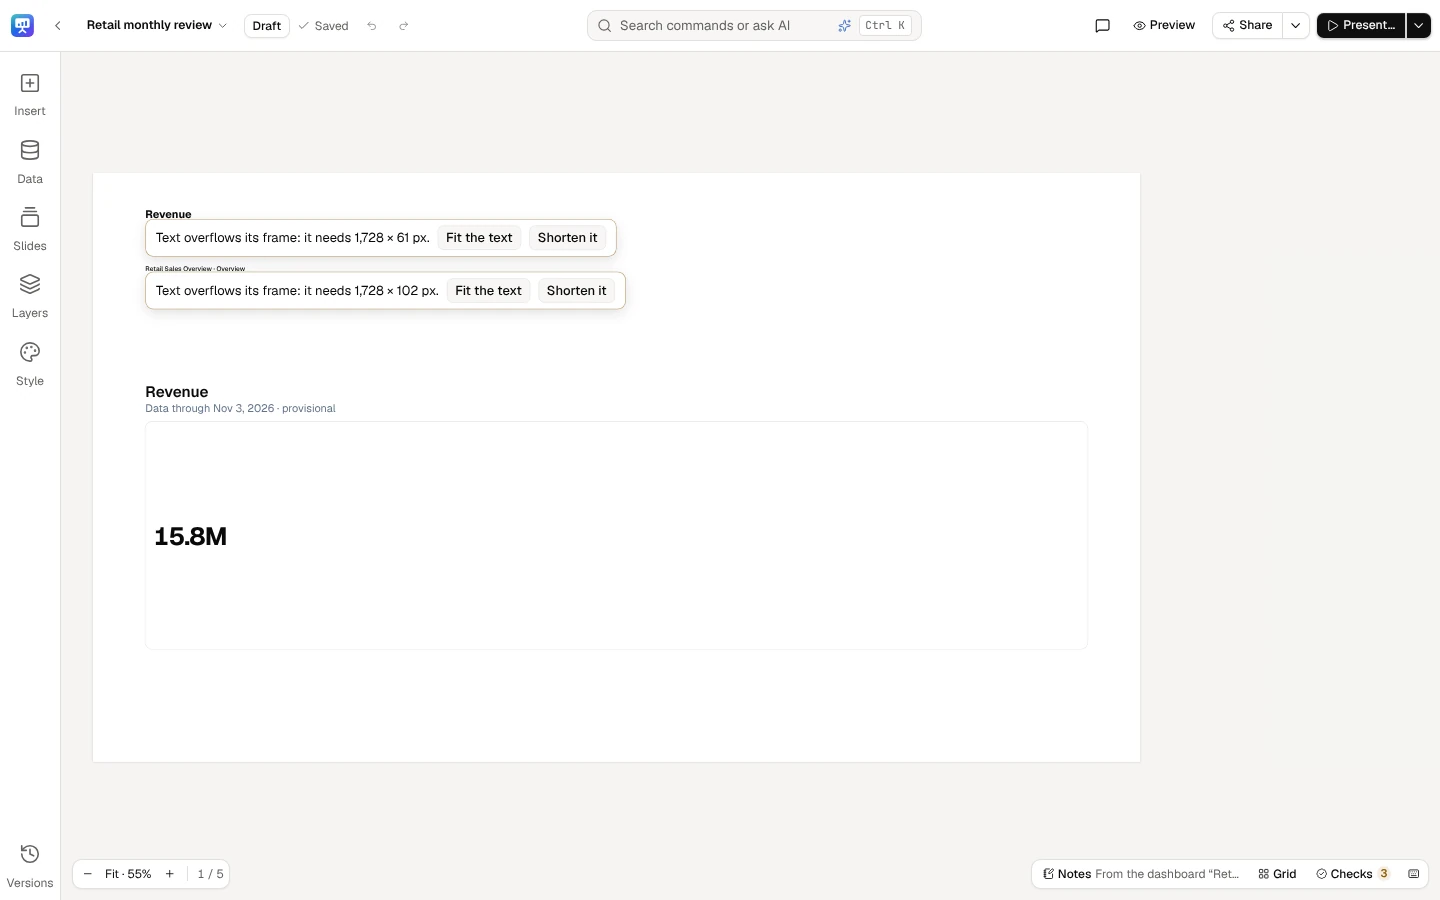
The title’s menu: Rename…, Page size…, Copy for next period…, Make a story…, Archive and Delete….
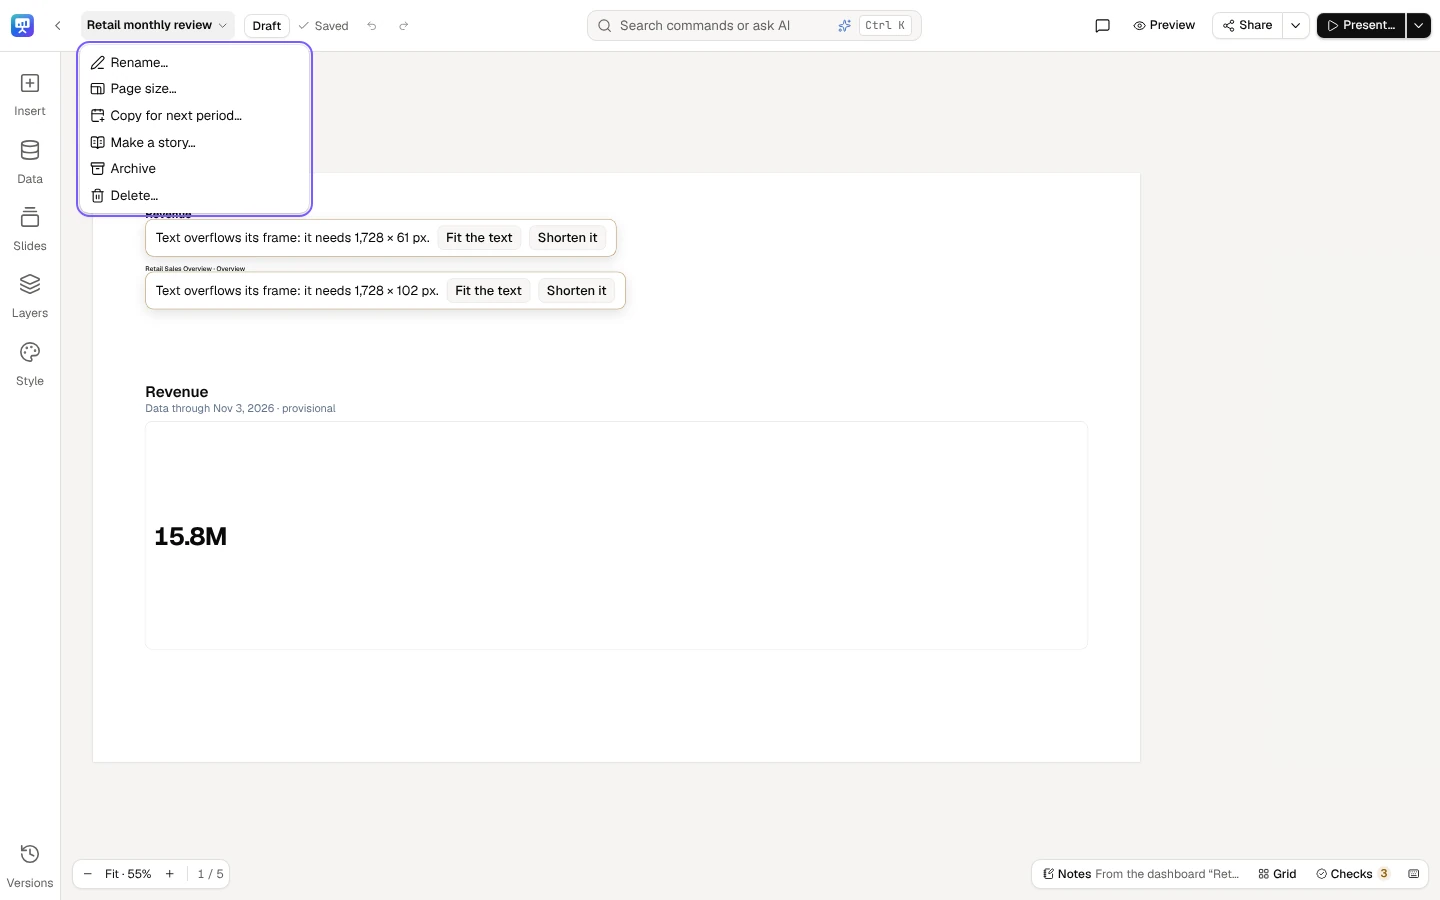
Share’s arrow (More sharing actions) holds Publish… and Ask for review… (Readers… too, once the deck is published), Checks, then Links and embed…, Export a file… and Schedule sends….
Present…’s arrow (More presenting actions) holds Next meeting… and Filters presenters may change… (and Freeze for the meeting… once there is something to freeze).
On a phone or a narrow window
Section titled “On a phone or a narrow window”Editing needs a window at least 1024 px wide. On a phone, a tablet held upright or a narrower window, a deck opens in its reading view (below), which says so in one plain line: Editing needs a window at least 1024 px wide. You can read, comment and present here. Widen the window and the editor comes back. A deck is made only where it can be edited, so there the New presentation page says at the top Creating needs a window at least 1024 px wide. You can look through the templates here., and each way says it needs a wider window. The templates still open, to look through; making a deck from one, and Blank presentation on the home, say the same line instead.
Reading a deck
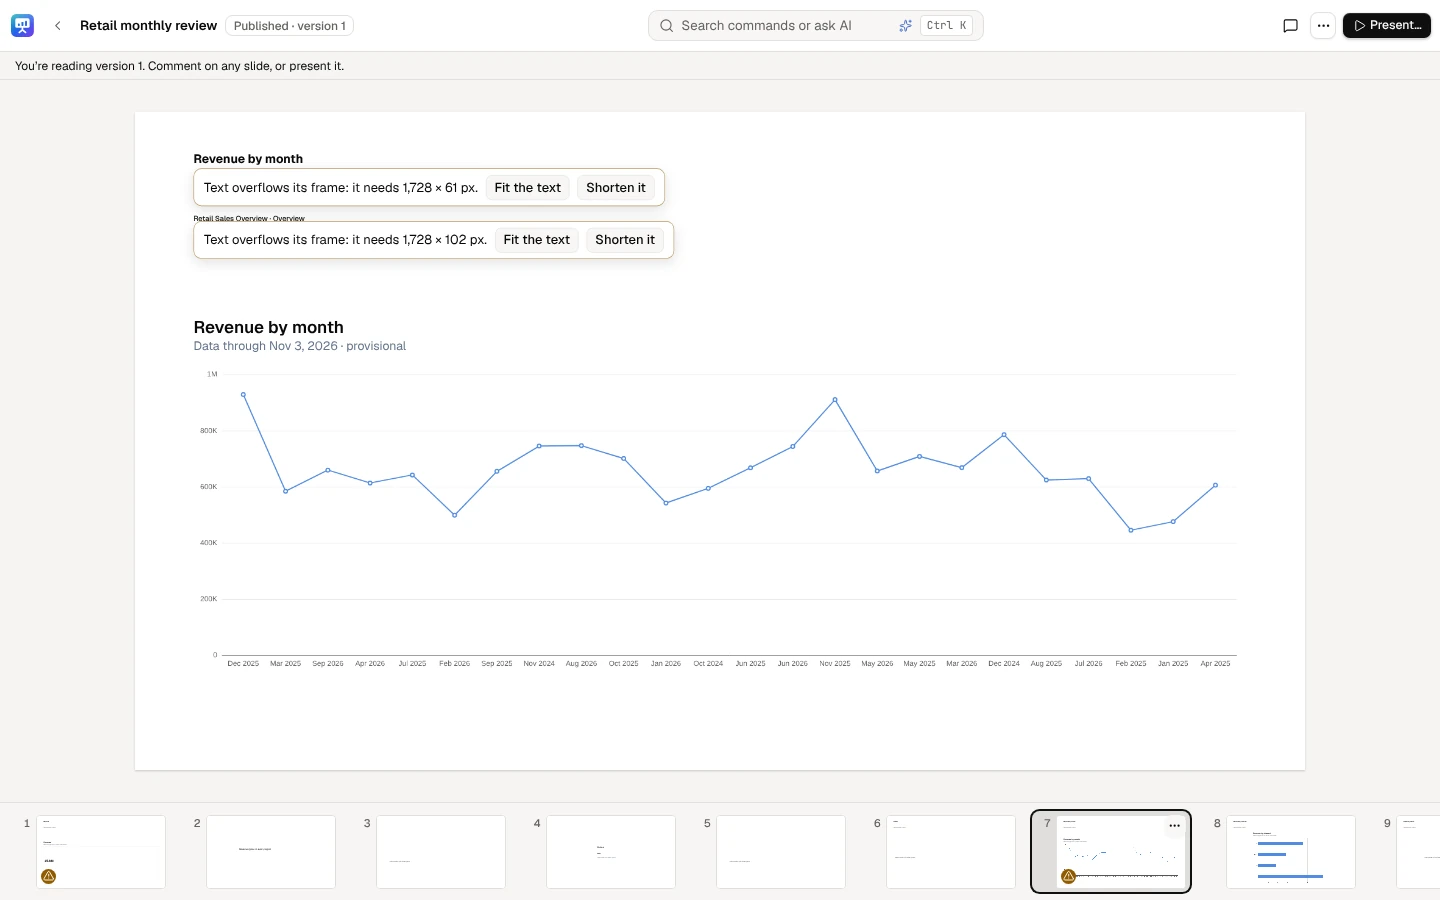
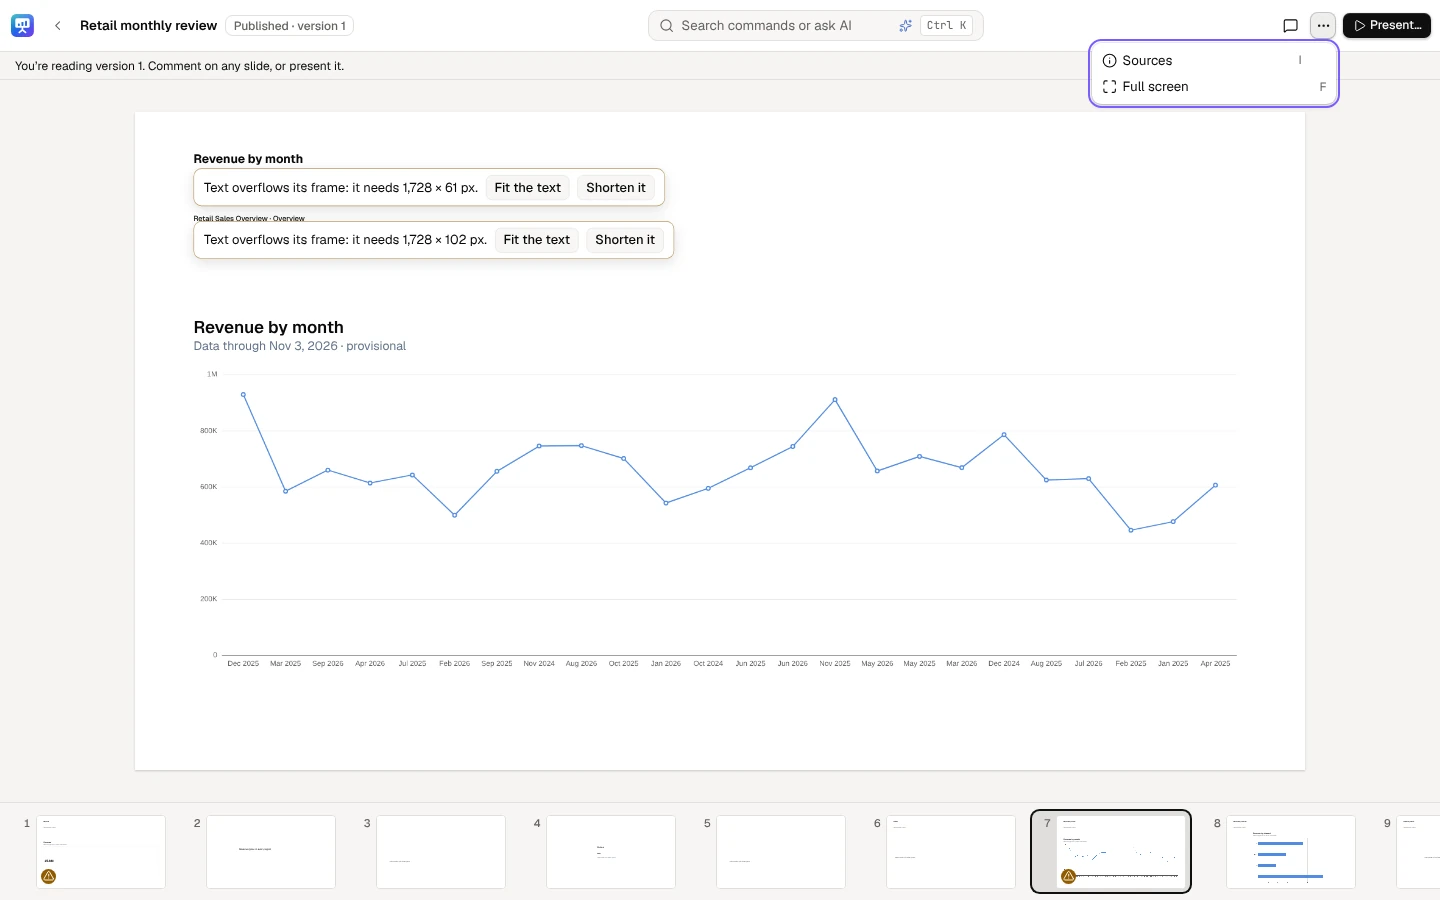
Section titled “Reading a deck”Viewers and commenters open a deck to read it: the slide large with its strip of slides under it. Its bar has Comments (commenters write, viewers read), More actions (⋯), which holds Sources (or press I) for where a slide’s figures come from, Make a story… (for people whose role can make stories) and Full screen, and the main button Present…. Someone who may edit gets Edit as the main button instead, with Present… in More actions; on an archived deck its editors and owner get Restore. Search commands or ask AI stays in its bar (an icon on a phone), with Ctrl+K: it finds what the reading view can do. The arrow keys, Page Up, Page Down and Space move between slides; Home and End jump to the first and the last. Everyone reads here on a window narrower than 1024 px, and on an archived deck. Its makers can choose Preview, in the editor’s top bar, to see the published version as readers do, without its hidden slides, its figures read with their own access. A deck never published says readers can’t open it yet, and offers Preview the draft. Edit takes them back.
A viewer reads the published deck: the slide with its strip, Comments, More actions and Present….
More actions holds Sources (or press I) and Full screen; Make a story… is there too for someone who can make stories.
Full screen
Section titled “Full screen”Full screen (in the reader bar's More actions), or F anywhere outside a text field, shows the slide alone in your browser's full screen: no menu, no header, no toolbars or panels. Move the pointer, tap the screen or pressTab (the control is the first stop) to show the small Exit full screen control at the top right; it hides again after 2 seconds. Esc or F leaves, and puts you back on theFull screen button. A screen reader hears it go in and out.
In a desktop browser's full screen the browser takes Esc itself: it leaves full screen first, and a card's Expand, a dialog or a list you opened stays open, to close with its own control or a secondEsc. Where the view fills the window instead (below), Esc closes what is open first.
It is reading, not presenting: no meeting and no record. Previous and Next are in the exit control; a click on the slide’s right third goes on and on its left third goes back, and a swipe sideways does the same on a touch screen. The arrows, Home, End and I work as they do when reading. A maker’s Preview goes full screen the same way, with the previewed version’s slides.
Where the browser doesn't allow full screen (a page embedded without the permission, Safari on an iPhone), the same view fills the window instead, and says so once.
Archive, restore and delete
Section titled “Archive, restore and delete”Archive (in the title’s menu, or a deck’s ⋯ menu on the home; the deck’s editors and owner) pauses a deck: its links and embeds don’t open, it can’t be presented (an open present window ends with This deck was archived; restore it to present it., and a paired phone says the same), its schedules skip their sends and nobody can change it, set its next meeting or copy it for the next period. It moves to the home’s Archived tab. Restore (there, or in the archived deck) brings it back as it was: published again if it was, with its links, embeds and schedules carrying on. The message says what paused and what carries on.
Delete… (the deck’s owner) asks first, then moves the deck to the Recovery Center for the days your workspace keeps deleted items, where an admin can bring it back as a draft. It leaves everyone it’s shared with straight away, and its links, embeds and schedules stop. A deck brought back that way keeps them off: its owner makes new links and adds it to the embed apps again.
Elements
Section titled “Elements”Insert, on the rail, puts these on the slide shown:
| Element | What it is |
|---|---|
| Text box | Text with live numbers, in the deck’s text styles or a format of its own |
| KPI tile | A metric’s figure, with its change and period |
| Chart | A metric broken down by a field, drawn honestly |
| Table | A metric by a field; a cut to the top rows is always said (Top 10 of 512) |
| Dashboard visual | A dashboard card, bound, drawn as its dashboard draws it; Make it an editable chart to change it in the deck |
| Picture | A PNG, JPEG or WebP of up to 20 MB, kept with this deck and shown only to people who can open it |
| Shape | A rectangle, rounded rectangle, ellipse, triangle, diamond, arrow or chevron, in the deck’s colours |
| Line and Arrow | A line across the slide, with or without an arrowhead |
| Icon | From the built-in set |
A picture copied from another deck is copied into this deck first; a picture from outside DataSquares is copied in when you insert it, so the deck never depends on someone else’s link.
Slides lists every slide in order. Drag a slide to move it; its ⋯ menu holds the slide’s own actions.
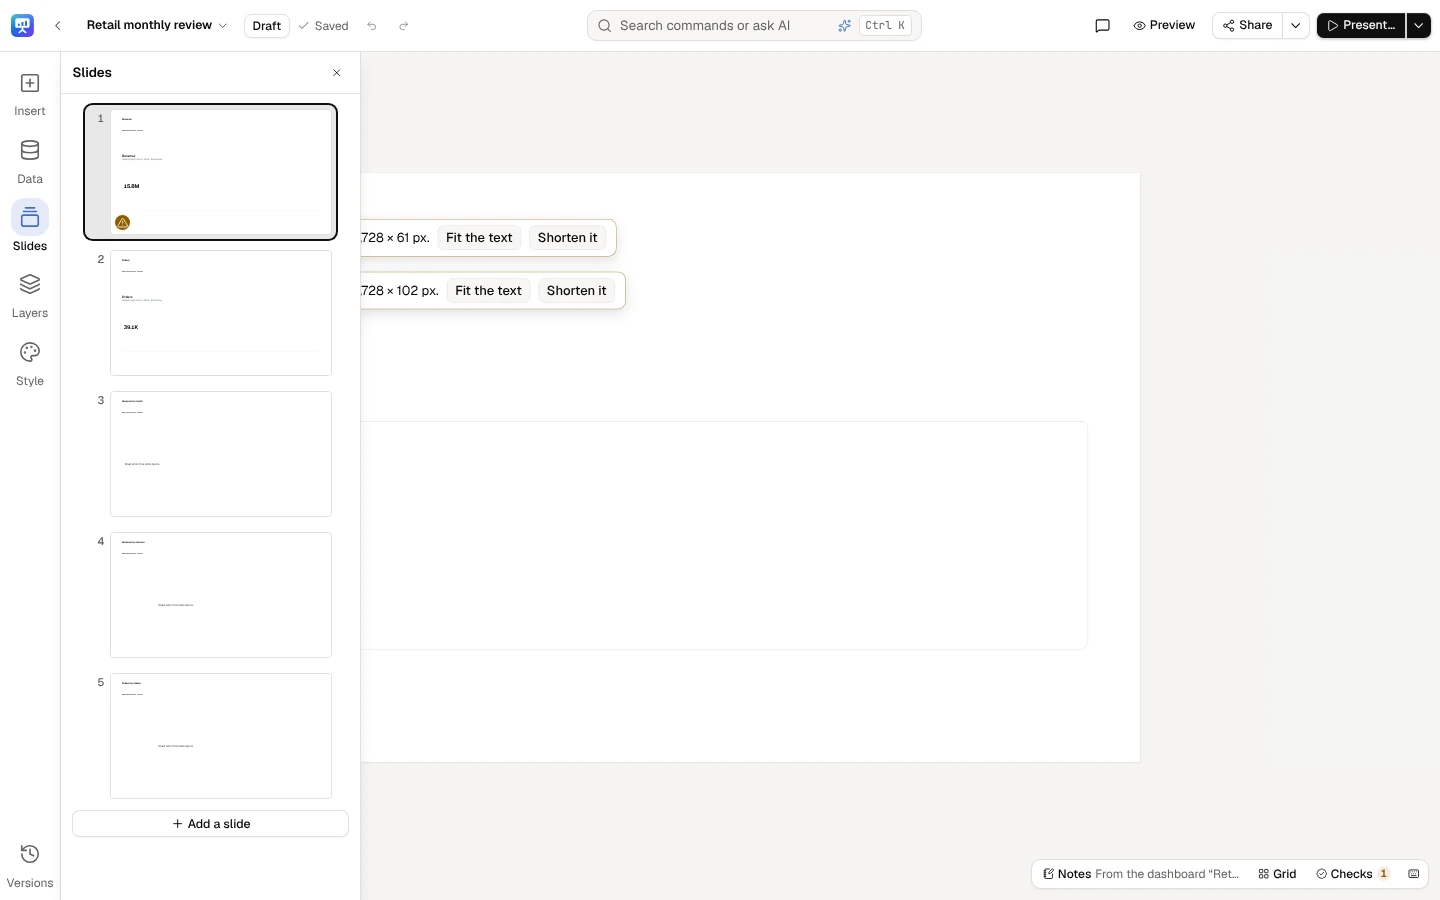
Add a slide opens New slide: choose its layout (you can change it later).
Insert lists what goes on a slide: Text box, KPI tile, Chart, Table and Dashboard visual; Picture, Shape, Line, Arrow and Icon; and Draft slides with AI.
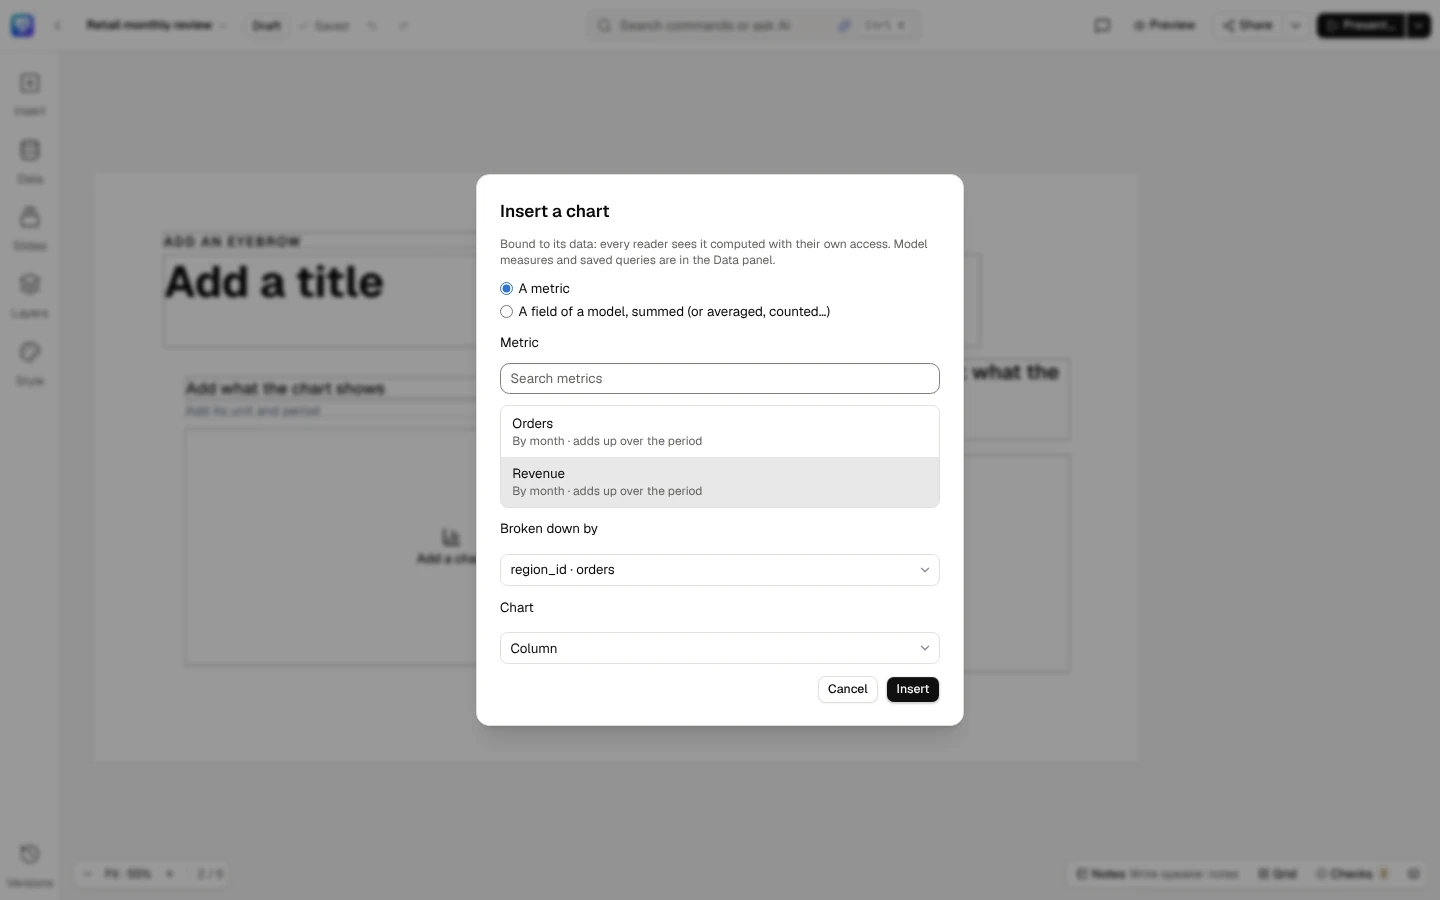
Insert a chart binds it to a metric (or to a field of a model) and asks for its type. Every reader sees it computed with their own access.
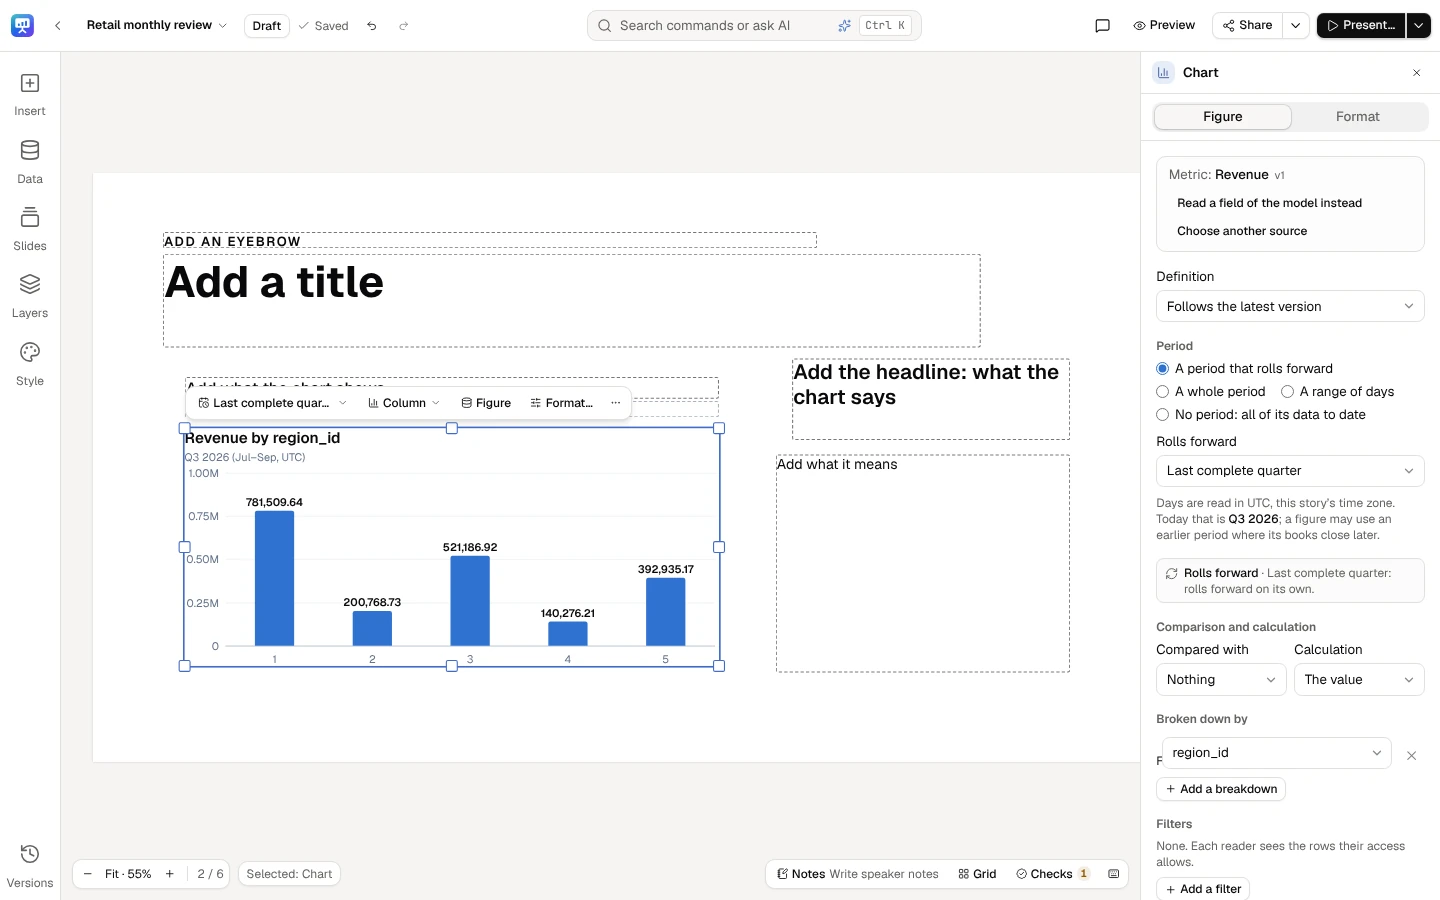
The chart is on the slide, live. Select it to open its Figure and Format tabs in the panel at the right.
Colours and fonts
Section titled “Colours and fonts”Every colour and font in a deck is a tile: a colour’s swatch with its name or code, a font’s name in its own face. Choose one to open the colour panel or the font panel in the selection’s panel; Back returns to the tile. Ctrl+K finds each by its name (Line colour, Highlight, Font).
| Where | Colour tiles | Font tiles |
|---|---|---|
| The quick bar | A shape’s Fill colour and Outline colour, a line’s Line colour, an icon’s Icon colour, a text box’s Text colour (and Highlight, in More actions) | A text box’s Font |
| The Format tab | The same, and a picture’s Border | A text box’s Font |
| A style part’s panel | Fill, Outline and Colour | — |
| The master’s Text styles (Edit the master…) | Each style’s Colour | Each style’s Font |
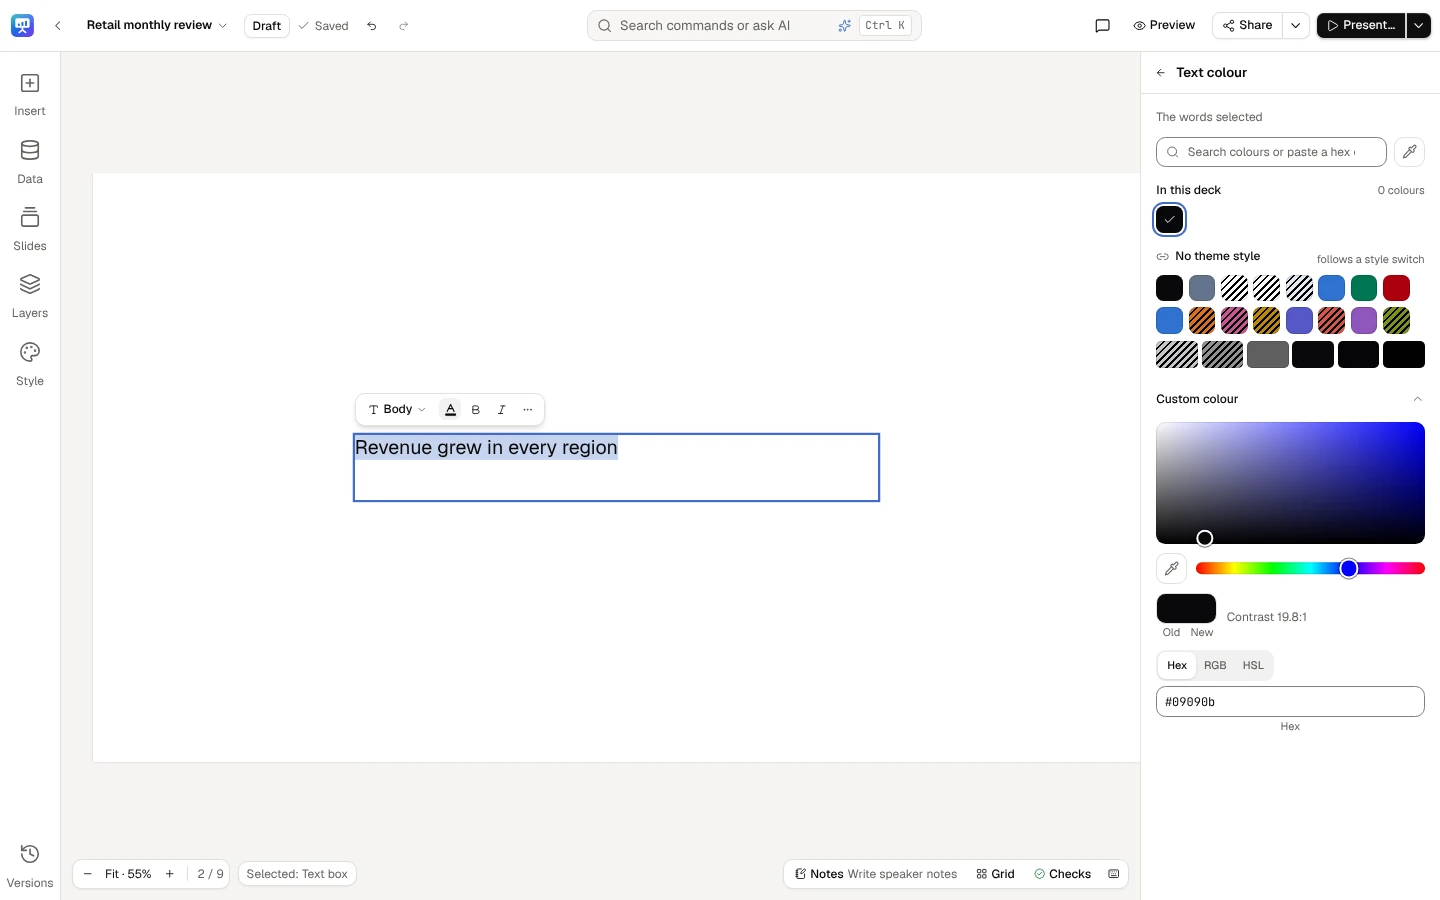
The colour panel lists In this deck (its colours, most used first), the style’s colours under its name with their shades (kept as the style’s, so they follow a style switch), your brand kit, colours from the deck’s pictures, and Custom colour, open from the start; search finds a colour by name, a word such as dark blue, or a hex code. A shape’s fill and outline, and a style part’s, can be see-through (Opacity); text, lines, icons and highlights are solid. A line always has a colour; the others have their none: No fill, No outline, No highlight, No border, and for a text box or an icon The style’s text colour. A text colour shows its contrast on what the text sits on, at 4.5:1, and a shape’s, a line’s or an icon’s at 3:1. A colour under its line is hatched and called low contrast: a warning, never a block, so the colour you pick is always set. A picture’s border takes the style’s colours alone, and the panel says so: A picture’s border takes the style’s colours, so it follows a style switch. A text box in several colours (or highlights) takes the colour you pick whole; in Custom colour, the old swatch, several colours, puts each word’s own colour back. While you type in a text box, Text colour stays on its quick bar, and a pick changes only the words you selected (the panel says The words selected), whatever colours the rest of the box holds. The stage shows a colour as you drag it, and a pick, or a whole drag in Custom colour, is one step Undo takes back.
The master’s text styles. In Edit the master…, each of the nine text styles has a Font tile, named with its weight (Geist SemiBold), which opens the font panel with every family’s weights and italics, and a Colour tile (The style’s text colour when it has none of its own), whose contrast is read on the slide’s background. What you change there waits in the master until Save the master.
Change all
Section titled “Change all”After a pick, the panel’s foot says where else the deck holds the colour or font you started from, and offers to
change it there too. Say a quarterly business review’s callouts were pasted in last year’s orange, #DC701C: two on
slide 4 and one on slide 7. You give one on slide 4 the style’s Accent, and the foot says #DC701C is in 2 more
parts on 2 slides., with This slide and All slides. All slides changes both and says Changed 2 parts on 2
slides. This slide changes the one beside it (Changed 1 part on this slide.) and then offers the rest: #DC701C
is in 1 more part on 1 other slide., with All slides. Where every one is on the slide you are on, the foot has a
single Change all.
- What it reaches. An element’s fill, outline, line, icon, words and highlights, and the colours of the style’s parts each slide draws (a slide’s own change of that part). A code and a style colour that paint the same are one colour. It leaves out a locked element, a part hidden on its slide, a see-through colour where only solid ones are drawn (words, lines, icons), and a picture’s border unless the new colour is one of the style’s.
- A font. The font panel’s Change all counts the text boxes drawn in the font, each given the new one at the weight it was drawn in where the new font has it, else the nearest: a box in Geist ExtraBold becomes Lora Bold, Lora’s heaviest.
- The master’s text styles. A text style’s font or colour offers the master’s other text styles in it. In Meridian · Cobalt, where all nine are set in Geist, giving Title Lora says Geist is in 8 more text styles on this master., with Change all.
- Slides others are editing are left out, of the count too, and so are slides you can’t edit now; the foot says so under its offer. With someone on slide 7, the foot above says #DC701C is in 1 more part on this slide., with Change all, and 1 part on 1 slide others are editing, or you can’t edit now, stays as it is.
- Undo. Each slide changed is one step of its own, saved once, and Ctrl+Z takes it back on the slide you are on. When other slides changed too, the message that says so (Changed #DC701C to Accent on 2 slides.) offers Undo, which puts back, on every one of them, each setting Change all wrote that nobody has changed since. A part someone changed in between keeps that change, and the message says so: Undone on 1 slide; 1 part was changed since and keeps its change.
Under the colour lock the colour panel offers the style’s colours and the brand’s alone; under the font lock the font panel offers the brand’s fonts alone (see the brand and your deck).
A text box’s format
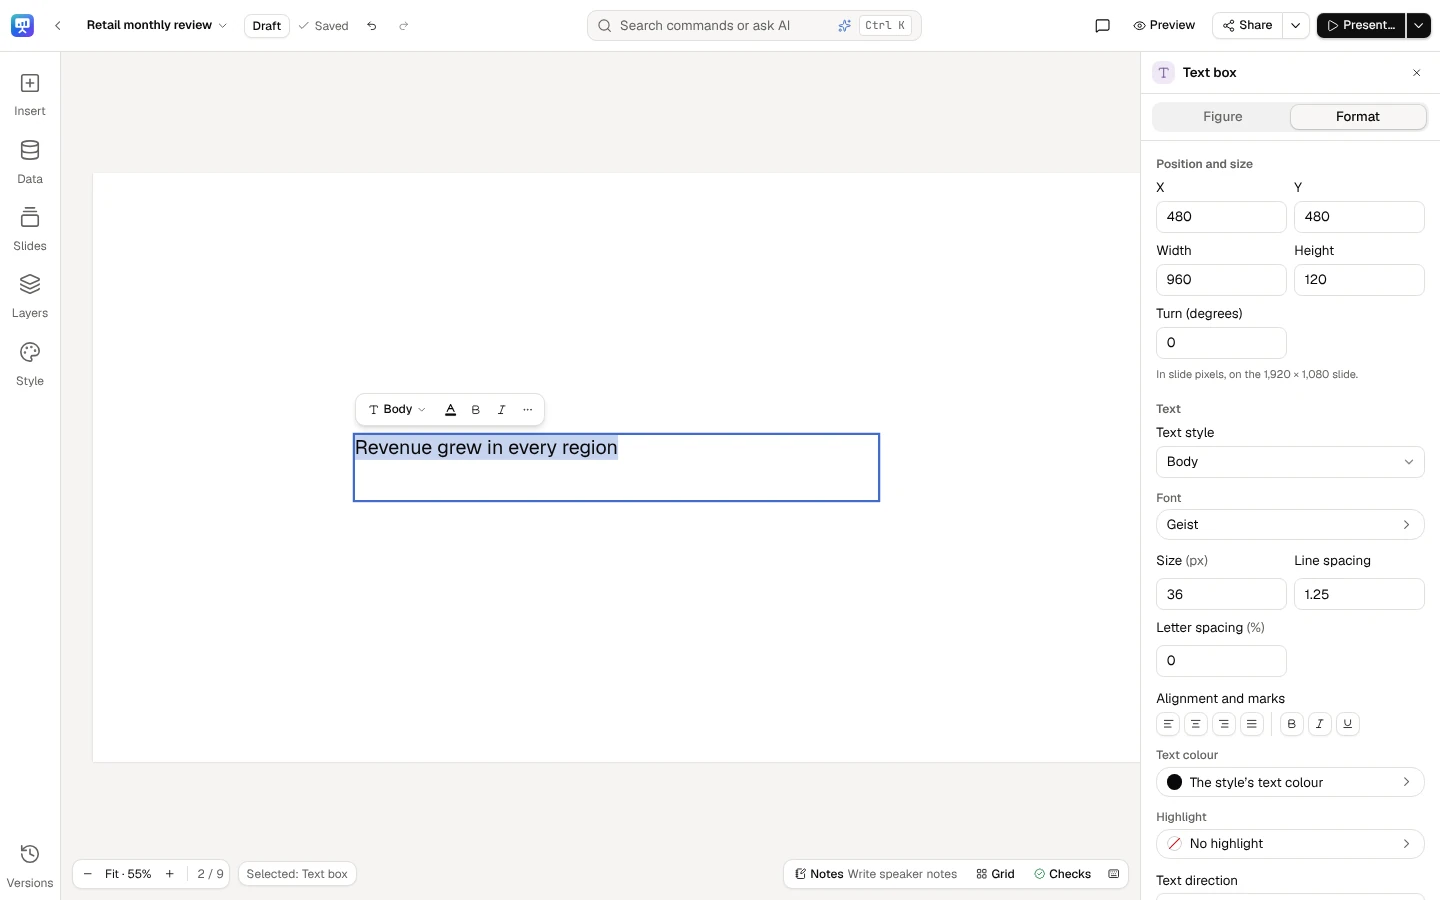
Section titled “A text box’s format”A text box can take a format of its own over its text style: its font and weight, size, line spacing and letter spacing, and another of the master’s text styles. Select it and choose Font on its quick bar, or open the selection’s panel’s Format tab, where Text holds:
| Field | What it sets |
|---|---|
| Text style | One of the master’s nine: Display, Title, Subtitle, Body, Caption, Eyebrow, Number, Label and Quote (a deck with no style offers Title, Subtitle and Body); Mixed where its paragraphs differ |
| Font | A tile with the font and its weight (Lora Bold), opening the font panel |
| Size (px) | 18 to 400 px: slide text is never smaller than 18 px |
| Line spacing | 0.8 to 3 times the size |
| Letter spacing (%) | −10 % to 50 % of the size. A Meridian · Cobalt title reads −2.2, its style’s |
| Alignment and marks | Align left, Centre, Align right or Justify; Bold, Italic, Underline |
| Text colour and Highlight | Tiles opening the colour panel |
| Text direction | See Right-to-left text |
A size or spacing of the box’s own says This box’s own: empty it for its style’s.; a value out of bounds is said (A size is 18 to 400 px: slide text is never smaller than 18 px.) and not written. Each change is one step Undo takes back. What equals its style is left to the style, so a change to the master still reaches the box. The format sets every line of the box, its title and subtitle lines too, as selecting a whole text box in PowerPoint does.
In the font panel, each family’s weights unfold under it (Lora: Regular, Medium, SemiBold and Bold); choosing a family keeps the weight in hand, or takes the nearest it has. Resting on a family shows the box in it on the stage until you move on. At the foot, Use the style’s font (Geist) takes the box’s own font and weight away; a box in its style’s font says In the style’s font, Geist. The panel’s second tab, Text styles, lists the master’s nine, each drawn in its font and weight and named with its font, weight and size. Choosing one sets the box in it whole: Title or Subtitle makes its paragraphs that heading, any other sets them in that style, and its own font, size, weight and spacing go.
When you edit together, each setting of a box’s format is its own: two people changing the font and the size of one box at once both keep their change, and two changing the same setting keep the last one made.
Present mode, readers and every file draw the box as the editor does. The PDF, the PNG and the PowerPoint file set its font, weight, size, line spacing and letter spacing on every line, indent its lists by its size, and set it in its own text style where it has one, keeping its placeholder’s colour, alignment and place. A weight its font lacks is drawn in the font’s nearest face, as your browser draws it. The PDF embeds the face; PowerPoint names it (a face between Regular and Bold by its own name, Montserrat SemiBold) with the letter spacing on the words and the line spacing on the paragraphs. Arabic letters stay joined: letter spacing widens the spaces between Arabic words and the Latin letters beside them, never the gaps between Arabic letters, in every file as on the stage. A deck with no text box of its own format exports exactly as before.
Under the font lock a box’s font is one of the brand’s.
Select a text box: its quick bar leads with Font, the text style, Bold, Italic and Text colour; the panel at the right holds its Format.
Text colour opens the colour panel: the deck’s colours, the style’s with their shades, Custom colour, and the contrast on what the text sits on.
Edit a picture
Section titled “Edit a picture”Select a picture to change it in the selection’s panel’s Format tab (or Edit the picture… on its quick bar), or open it (double-click, Enter or F2) to change it in a dialog, where Done closes it. The slide shows each change as you make it, and each is one step Undo takes back: a slider’s drag, or a run of arrow keys on the crop, is one step.
| Option | What it does |
|---|---|
| Crop | Drag the frame or its handles over the picture, or type the part shown, in percent. Crop shape holds the frame to a shape: as the picture, square, 4:3, 3:2, 16:9 or their portrait turns. With the frame focused, the arrow keys move it, Shift+arrows resize it and Ctrl takes bigger steps. The picture stays where it is on the slide and its frame becomes the part shown; Show the whole picture brings the rest back |
| Turn and flip | Turn a quarter left or right; flip left to right or top to bottom, as the picture shows on the slide |
| Brightness, Contrast and Saturation | From 0 to 200 %, on a slider or typed; 100 % leaves the picture as it is |
| Filter | None, Mono, Warm, Cool, Vivid or Fade, each shown on your own picture |
| Opacity | From 0 to 100 % |
| Shape | Rectangle, Rounded, Circle or Pill. A circle crops a picture that isn’t square to the largest square in it |
| Border | Its colour a tile opening the colour panel on the style’s colours alone, so it changes with the style (No border takes it away); 1 to 40 px wide, 4 px when you first give it a colour, inside the picture’s edge |
| Shadow | None, Soft or Lifted |
| Alt text | What the picture shows, for people who can’t see it. Leave it empty only for decoration: the checks ask about an empty one (L4) |
| Replace… | A new PNG, JPEG or WebP from your computer, with the other options kept; its crop starts again, and a circle’s new picture is cropped to the largest square in it. The other options wait while it uploads |
| Reset | Every option back to none; the alt text stays |
Present mode, readers and shared links show a picture exactly as the editor does. A photo whose file says it is to be turned (as phones write a photo taken on its side) shows turned, as your browser shows it, in the editor and in every export, at the size it shows at; in a PowerPoint file it is turned by the picture’s own rotation. The PDF and the PNG draw a PNG or JPEG picture with options as the editor shows it; a picture without options fills its frame there, so in a frame stretched to another shape than the picture the part that doesn’t fit is cut off. A WebP picture, or one of more than 40 megapixels (an 8000 × 6000 photo is 48), is a box that says so in every export: replace it with a PNG or JPEG, or a smaller copy. A PowerPoint file keeps the crop, turn, flips, shape, opacity and shadow as PowerPoint’s own picture settings, so you can change them there; the colours are applied to the picture itself, and the border is an outline over it. On a faded picture the border is drawn around the picture rather than over it, so the two fade as one: the picture’s crop leaves out the strip under the border, and a Circle stretched into an oval is cut along the border’s inner edge, a shape of its own rather than PowerPoint’s oval.
Right-to-left text
Section titled “Right-to-left text”Arabic, Hebrew, Persian and Urdu run right to left on a slide, with nothing to set: each paragraph takes the direction of its first letter, so a paragraph that starts in Arabic runs from the right and lines up there, and one that starts in English stays left to right, even in the same text box.
- Set a paragraph’s direction. While editing a text box, Right to left and Left to right (in its quick bar’s More actions) set the paragraphs your caret or selection is in. Press the same button again and the paragraph goes back to running by its letters.
- Set a whole text box. Select it and choose Text direction in the selection’s panel’s Format tab: By its letters (each paragraph by its first letter), Right to left or Left to right. A paragraph you set yourself keeps its own direction.
- Alignment and lists follow the direction. A right-to-left paragraph starts at the right; a layout’s left-aligned text box starts at the right for it, and a centred one stays centred. A list indents from the right, with its bullets and numbers at the right, reading 1. from the right.
- Numbers keep their order. A live number, a period or a figure typed by hand in right-to-left text keeps its digits, sign and unit in order ($4.82M), written in the deck’s number format. A figure you type in Arabic-Indic digits (١٢٪) is flagged by the checks like any typed figure, until you bind it.
- Fonts that shape the letters. Two fonts in the design library shape these scripts: Noto Sans Arabic (Arabic, Persian and Urdu letters) and Noto Sans Hebrew, each with Latin letters too, and each named with its scripts in the font panel (Arabic and Latin). A text box or a chart in a font without Arabic or Hebrew letters shows those letters in the font that has them, in the editor, present mode and every export alike, and the Format tab says so: This font has no Arabic letters: shown in Noto Sans Arabic. Letters no font in the library has, such as Devanagari or Thai, are named there too: the PDF and pictures show them as boxes, so replace them or keep them out of decks you export. These two fonts shape right-to-left letters in presentations only: a report or a dashboard set in them exports its Arabic or Hebrew letters as boxes.
Undo takes a direction back, people editing the slide together see it at once, and versions keep it. Present mode, the presenter window, thumbnails, links, the kiosk and a deck kept for presenting offline draw right-to-left text as the editor does. The exports:
| Export | Right-to-left text |
|---|---|
| PDF and PNG | Shaped in the same fonts and ordered as in the editor: numbers and figures in order, brackets around Latin text, a line after Shift+Enter or a blank line, lists at the right, a justified paragraph’s last line at the right. In the PDF, copying, searching and screen readers read a right-to-left line’s own words. A chart’s Arabic or Hebrew labels are drawn as the font’s outlines: they show as in the editor, but in the PDF they can’t be selected or searched; the chart’s alt text says each one |
| PowerPoint | Each right-to-left paragraph is marked so, with its alignment and its list’s markers at the right, and PowerPoint orders its lines itself. Its Arabic and Hebrew letters name Noto Sans Arabic or Noto Sans Hebrew as their font: with those fonts installed they show as in the editor, without them in PowerPoint’s own. A native chart’s labels are PowerPoint’s to draw |
Slides, sections and notes
Section titled “Slides, sections and notes”A slide’s ⋯ menu in Slides (or Shift+F10 on a focused slide) offers New slide after, Duplicate slide, Tidy slide, Hide slide (a hidden slide is skipped when presenting and exporting), Start a section here and Delete slide…. A deleted slide can be brought back with Undo, in the middle of the slide’s foot. Sections group the strip; renaming or deleting a section keeps its slides.
Notes, at the slide’s foot, opens the slide’s speaker notes, which can hold live numbers too. Notes are for the deck’s contributors, editors and owner; viewers and commenters never receive them. Their bar has Suggest a headline and Write speaker notes, which have the AI write from the slide’s figures, every figure live: see Headlines and speaker notes.
Layers and reading order
Section titled “Layers and reading order”Layers lists the slide’s elements in reading order, which is the order a screen reader and Tab follow. Move an element with Alt+↑ / Alt+↓ in the list, lock or unlock it, or change its layer: Bring to front, Bring forward, Send backward, Send to back. A locked element is not moved or changed by mistake, not even by a fix from the checks. A group is a folder, its elements listed under it (its chevron folds and opens it, and so do → and ←): choosing one of them selects it inside its group, and its layer and reading order are within the group. Rename a group with Rename… in its row’s menu, or F2 on its row; that name is the one the slide’s menu and a screen reader say, and an empty name gives back Group. Style parts, folded at its foot, lists what the style draws beneath the elements (below).
Select, group and right-click
Section titled “Select, group and right-click”Select several elements. Shift-click or Ctrl-click an element to add it to the selection, or to take it out
(on a Mac ⌘-click: there Ctrl-click opens the menu instead); a drag box drawn with either key held adds what it
touches. Ctrl+A selects every element on the slide. Alt and a drag duplicates what you drag, and holding
Ctrl once a drag is under way moves without snapping.
Group them. Group (Ctrl+G, ⌘G on a Mac), first on the quick bar of several elements and in their right-click menu, makes them one object that selects, moves, resizes, locks, aligns, changes layer, copies and deletes as one. Resizing a group scales its elements’ frames, never their text’s size, so a heading stays in its style. Ungroup (Ctrl+Shift+G) gives each element back its own frame and layer. Groups don’t nest: grouping a selection that holds groups merges them into one group. A group holds up to 50 elements; a layout’s placeholder, a data slot and a locked element stay on their own, and the editor says why. Grouping never changes what is drawn over what: an element lying between the grouped ones stays in front of the group, and where that can’t hold, Group says which element to move first. In present mode a group comes in as one (choose its entrance under Animate in Motion); an element’s own entrance waits until it is ungrouped.
Work inside a group. A click on any of its elements selects the whole group. Click it again, or double-click, to go into the group with the element under the pointer selected; Enter goes in from the keyboard, its first element selected. Inside, an element moves, resizes and is edited on its own, and the group’s frame follows it. Esc selects the whole group again. Shift-, Ctrl- or ⌘-click on a group adds or removes the whole group.
Say the cover of a Q3 business review for Europe has a KPI tile for Revenue, its label and a small arrow icon. Select the three, press Ctrl+G, and they move, align to the slide and come in together; double-click the tile to change its period without ungrouping.
The right-click menu. Right-click an element, several, or the empty slide (Shift+F10 or the Menu key from the keyboard; on a Mac, Ctrl-click). A right-click outside the selection selects first; inside it, the menu acts on everything selected. Every row is a command of the editor, with its shortcut, as on the quick bar and in Ctrl+K:
| Right-click on | The menu |
|---|---|
| One element | Cut, Copy, Paste, Duplicate, Delete; Copy style, Paste style; Ungroup (a group, or an element in one); what its kind does (Edit text, Edit the picture…, Change the icon…, Choose data, Figure, Flip horizontally, Flip vertically, Set as background, Alt text, The chart’s alt text…); Layer (Bring to front, Bring forward, Send backward, Send to back); Align to slide; Lock; Comment and Format… |
| Several elements | Cut, Copy, Paste, Duplicate, Delete; Paste style; Group and Ungroup; Flip horizontally, Flip vertically; Layer; Align (the six alignments, Space evenly across and Space evenly down); Lock |
| The empty slide | Paste, Select all; New slide after, Duplicate slide, Hide slide (or Show slide), Delete slide…; This slide’s layout…, Tidy slide, Style and brand kit…; Detach background and Remove background where the slide has a background picture; Notes, Write speaker notes, Comments |
A command that can’t run now is dimmed; one that doesn’t apply is left out. Readers (a viewer or a commenter, or a window narrower than 1024 px) get Copy and Comment on an element and Comments on the slide. Text you are typing in keeps the browser’s own menu. See Right-click menus and selecting several things.
A style’s parts
Section titled “A style’s parts”A deck’s style draws its artwork beneath every slide’s elements: bands, circles, rules, the cards behind placeholders, the logo, the footer and the slide number. Each is a style part you can change on the slide in front of you, while the deck’s master keeps the style’s own for every other slide.
- One object until you ungroup it. On each slide the style’s artwork is grouped, as Canva groups a design: a click on any part of it selects the whole, Style artwork, outlined as one. Its panel says how many parts it holds, and it and the quick bar offer Ungroup (Ctrl+Shift+G), Hide on this slide (every part at once; under the logo lock the logo stays) and, where this slide changes a part, Reset; the panel keeps Edit the master. Delete hides the artwork on this slide, and the arrow keys say to ungroup it before moving a part. Double-click a part to reach it inside the group, or choose it in Layers.
- Ungrouped, each part is selected on its own, and Group (Ctrl+G), on a part’s quick bar and in its panel, makes the artwork one object again. Grouping or ungrouping is a step Undo takes back, saved with the slide and seen at once by everyone editing it.
- Select a part by clicking where it is drawn. An element over it still takes the click, and a shape with no fill (a frame, a ring) is selected on its outline, never across its middle. A dashed outline says it comes from the style. A press changes nothing until you let go, so the selection, its quick bar and its panel never flicker; a drag that starts on a part draws a selection box instead. A layout’s background is not part of the artwork: it is selected in Layers, never by a click on the slide, where a click still clears the selection.
- Change it in the selection’s panel, or from its quick bar:
- Fill and Outline for a shape, Colour for a rule, an icon, the footer or the slide number: tiles that open the colour panel (a shape’s fill and outline with No fill or No outline, and see-through), with Change all at its foot. The logo has no colours.
- Position and size (X, Y, Width and Height, in slide pixels), or drag it and its handles. The arrow keys move it to the next 8 px line (Alt: one pixel), and Shift with the arrows sizes it. A part may run off the slide, as the style’s artwork does. A layout’s background is coloured, never moved.
- Hide on this slide, or press Delete. Esc lets the part go.
- Where a change holds. The panel says it: As the style draws it., Changed on this slide only. or Changed on every slide. A change holds on this slide only, and then offers Apply to all slides, which makes it the deck’s own for that part on every slide, and Reset, which puts the style’s back on this slide. A part changed on every slide offers Reset every slide. Each change on the slide is a step Undo takes back; Apply to all slides and Reset every slide say what they did, with an Undo of their own. Whoever can edit a slide changes its parts there; only the deck’s editors apply a change to every slide or reset every slide. Edit the master stays in the panel for planned changes to the logo, the footer, the slide numbers and the text styles.
- In Layers, Style parts lists the slide’s parts, the front one first, each marked Changed here or Every slide, with an eye to hide it on this slide or show it again. A part hidden on the slide stays listed, struck through, so it can be found. Choosing one selects it on the slide, grouped or not: that is how the keyboard reaches the parts. Above them, Grouped: a click on the slide selects the artwork as one. (or Ungrouped: a click on the slide selects a part.) with Ungroup or Group.
Switching the deck’s style or a slide’s layout keeps your changes: a change to a part the slide no longer draws comes back with its style or layout. Say a quarterly business review in Meridian · Cobalt hides the ring on its cover, and gives the cover’s disc Data colour 2 with Apply to all slides. Switched to Atlas · Coral, which draws neither, the cover’s Style parts says 1 change kept for parts this slide doesn’t draw now (another style’s or layout’s)., with Reset, and 1 change on every slide kept for other styles’ parts., with Reset every slide. Switched back to Meridian, both are drawn again. A slide, and the deck’s defaults, can each change up to 64 parts.
While your company locks the brand’s logo, the logo can be selected, shows a padlock in Style parts (kept by your brand) and changes no further away from where the master puts it: the panel says Your company keeps the brand’s logo where the master puts it, on every slide. A logo moved, sized or hidden before the lock can always go back, with Reset, Reset every slide or by showing it again. Under the colour lock, a part’s colours are the style’s, which wear the brand, and the brand’s own.
The changes are saved with the slide, so a restored version brings them back, and comparing two versions names the parts changed on a slide (the cover’s above: Style part changed: ring). A copy of the deck or of a slide, and a template saved from it, keep them. People editing a slide together each keep their change, setting by setting, even on one part. Present mode, links, embeds, thumbnails and every export draw the slide as the editor does. Resizing the deck lays a part moved on a slide out again for the new size, as it does the slide’s elements; a part moved on every slide keeps that place only on the size it was moved on, and elsewhere is drawn where the style puts it, with its colours and whether it shows.
Tidy a slide
Section titled “Tidy a slide”Tidy slide, in a slide’s ⋯ menu in Slides, lines the slide up in one step, which Undo takes back:
- An element that fills one of its layout’s places goes back where the layout puts it; a text grown to hold its words keeps its size, as far onto the slide as it fits. What the layout laid out stays as it is: an element on its place, a list or a row of cards spaced evenly, a timeline’s marks under their dates. On a slide from the template library, as it comes, Tidy changes nothing.
- Every other element snaps to the 8 px grid, and an edge close to the slide’s margins lines up with them (a text box only by its left and top edges: its size is its words’). An element close to a margin that cannot go on it is left where it is. A text on a card moves with its card, by the same amount; elements on a background or a large panel are each tidied on their own, and stay on it.
- Elements side by side take the same top, and the same height where theirs are close; elements one above another take the same left edge, and the same width where theirs are close. Three or more are spaced evenly. Elements centred on one another stay centred. A turned element lines up by where it is drawn on the slide, and is never resized.
- A text box whose text was shrunk to fit grows to show it at the deck’s text sizes, as far as the slide, the element below it or the card under it allows.
- A text the checks find outgrowing its box (L1, L2) is sized as Fit the text sizes it.
Every move is checked before it is made: an element stays on the slide, never covers an element it did not cover before, stays on its card, and a text box, a KPI tile or a table never gets smaller, so its words still fit. A move that would break one of these is not made, and Tidy says which elements it left where they are, and why: only elements it did not move or resize at all. Tidying a slide a second time changes nothing.
Tidying only moves and sizes elements: every binding, figure and word stays as it is, and locked elements and lines stay where they are. It works by rules, not AI, and uses no credits.
Suggest a chart
Section titled “Suggest a chart”Select a chart and open Format in the selection’s panel: Suggest a chart type proposes the type that fits the chart’s data, says why, and shows the chart drawn that way.
| The chart’s data | Suggested |
|---|---|
| A change over time | A line; columns for two periods |
| Categories to compare or rank | Bars, largest first |
| Parts of a whole (shown as a pie, a donut, a treemap or a 100% stack, or each part’s share of the whole) | A pie of five parts or fewer that add up, none below zero; otherwise bars, largest first. Split by a second breakdown, 100% stacked bars |
| A breakdown with an order of its own (stages, sizes) | Columns, in that order |
| More series than the theme’s colours tell apart | A heatmap, shading each cell by its value |
What the chart’s values are comes from how its figure is calculated, not from how they are written: a share and a percent change are both percentages, but only a share can be a part of a whole. A change of any kind (a difference, a percent or point change, a growth rate) is shown as bars, never as parts of a whole, and a share of each series’ own total is shown as bars with a colour for each series, never as a 100% stack.
A share is suggested as a pie, or split as a 100% stack, only when its parts are shown to make the whole the chart draws:
- nothing filters the field the share is taken across (the share is of the whole without that filter, so the parts shown are not all of it);
- the figure is not a rate: a share of a figure written as a percentage or in points is never calculated;
- the shares add up to 100%, within half a point for rounding (in every bar when split).
Otherwise the suggestion is ranked bars, and it says why, for example what the shares add up to.
A suggested chart never has a second value axis. A waterfall, a funnel and a map are kept as they are: only you know their steps, stages and places. Apply changes the chart’s type and order in one step that Undo takes back; the chart keeps its data and its binding. Like Tidy slide, it works by rules, not AI, and uses no credits.
Builds: a step at a time
Section titled “Builds: a step at a time”A chart or a text box can come onto its slide a part at a time while you present. Select it and choose under Comes in when presenting in the selection’s panel’s Format tab: All at once (as every element does unless you choose), One series at a time or One category at a time for a chart drawn on axes, or One point at a time for a text box with a list. A pie, a donut, a treemap, a funnel, a heatmap or a map says it comes in all at once, and a text box without a list says it has no points yet. The change is one step that Undo takes back.
The editor and every thumbnail show the element whole; only present mode builds it. See Present.
Editing together
Section titled “Editing together”Several people can edit one deck at once, on the same slide too: their changes appear as they make them, Slides and the top bar show who is on which slide, and what each has selected is outlined with their name. Undo takes back only your own changes. The editor saves as you go; Ctrl+S waits until your last change is saved. See Edit a deck together.
Keyboard
Section titled “Keyboard”Press Ctrl+/ (or Keyboard shortcuts at the slide’s foot) for every shortcut. The ones you will use most:
| Keys | Does |
|---|---|
| Ctrl+K | Search commands or ask AI: every command of the editor by its name |
| Ctrl+Z / Ctrl+Shift+Z | Undo / redo on this slide |
| Arrows, Alt+arrows | Move the selected elements to the next grid line, or by one pixel |
| Shift+arrows | Resize the focused element |
| Enter or F2 | Edit the focused text box (Escape stops), or open a picture (its options and alt text), a chart (alt text) or an icon |
| Alt+F10 | Go to the quick bar of the selected element, or of the text being edited |
| Esc | Fold the open drawer, or go back from the quick bar to the selection |
| Ctrl+C / Ctrl+X / Ctrl+V | Copy, cut and paste elements, between decks too |
| Ctrl+D | Duplicate the selection, or the focused slide in Slides |
| Shift+click / Ctrl+click | Add an element to the selection, or take it out (⌘+click on a Mac) |
| Right-click / Shift+F10 | Open the menu of the selection, or of the slide (the Menu key too; Ctrl+click on a Mac) |
| Ctrl+Shift+L | Lock or unlock the selection |
| Ctrl+G / Ctrl+Shift+G | Group the selected elements / ungroup the selected group; with no element selected, group the style artwork again from one of its parts / ungroup it |
| Enter on a group | Go into the group, its first element selected (Esc leaves it) |
| Page Up / Page Down | Previous or next slide |
| Ctrl+= / Ctrl+- / Ctrl+0 | Zoom in, zoom out, fit the slide |