Data models & relationships
A data model sits between your raw data sources and your dashboards: a curated semantic layer of tables joined by explicit relationships, enriched with calculated fields, hierarchies, and SquareX measures. Dashboards built on the same model share its joins, security rules, and definitions, ensuring metrics stay consistent and governed across your entire workspace.
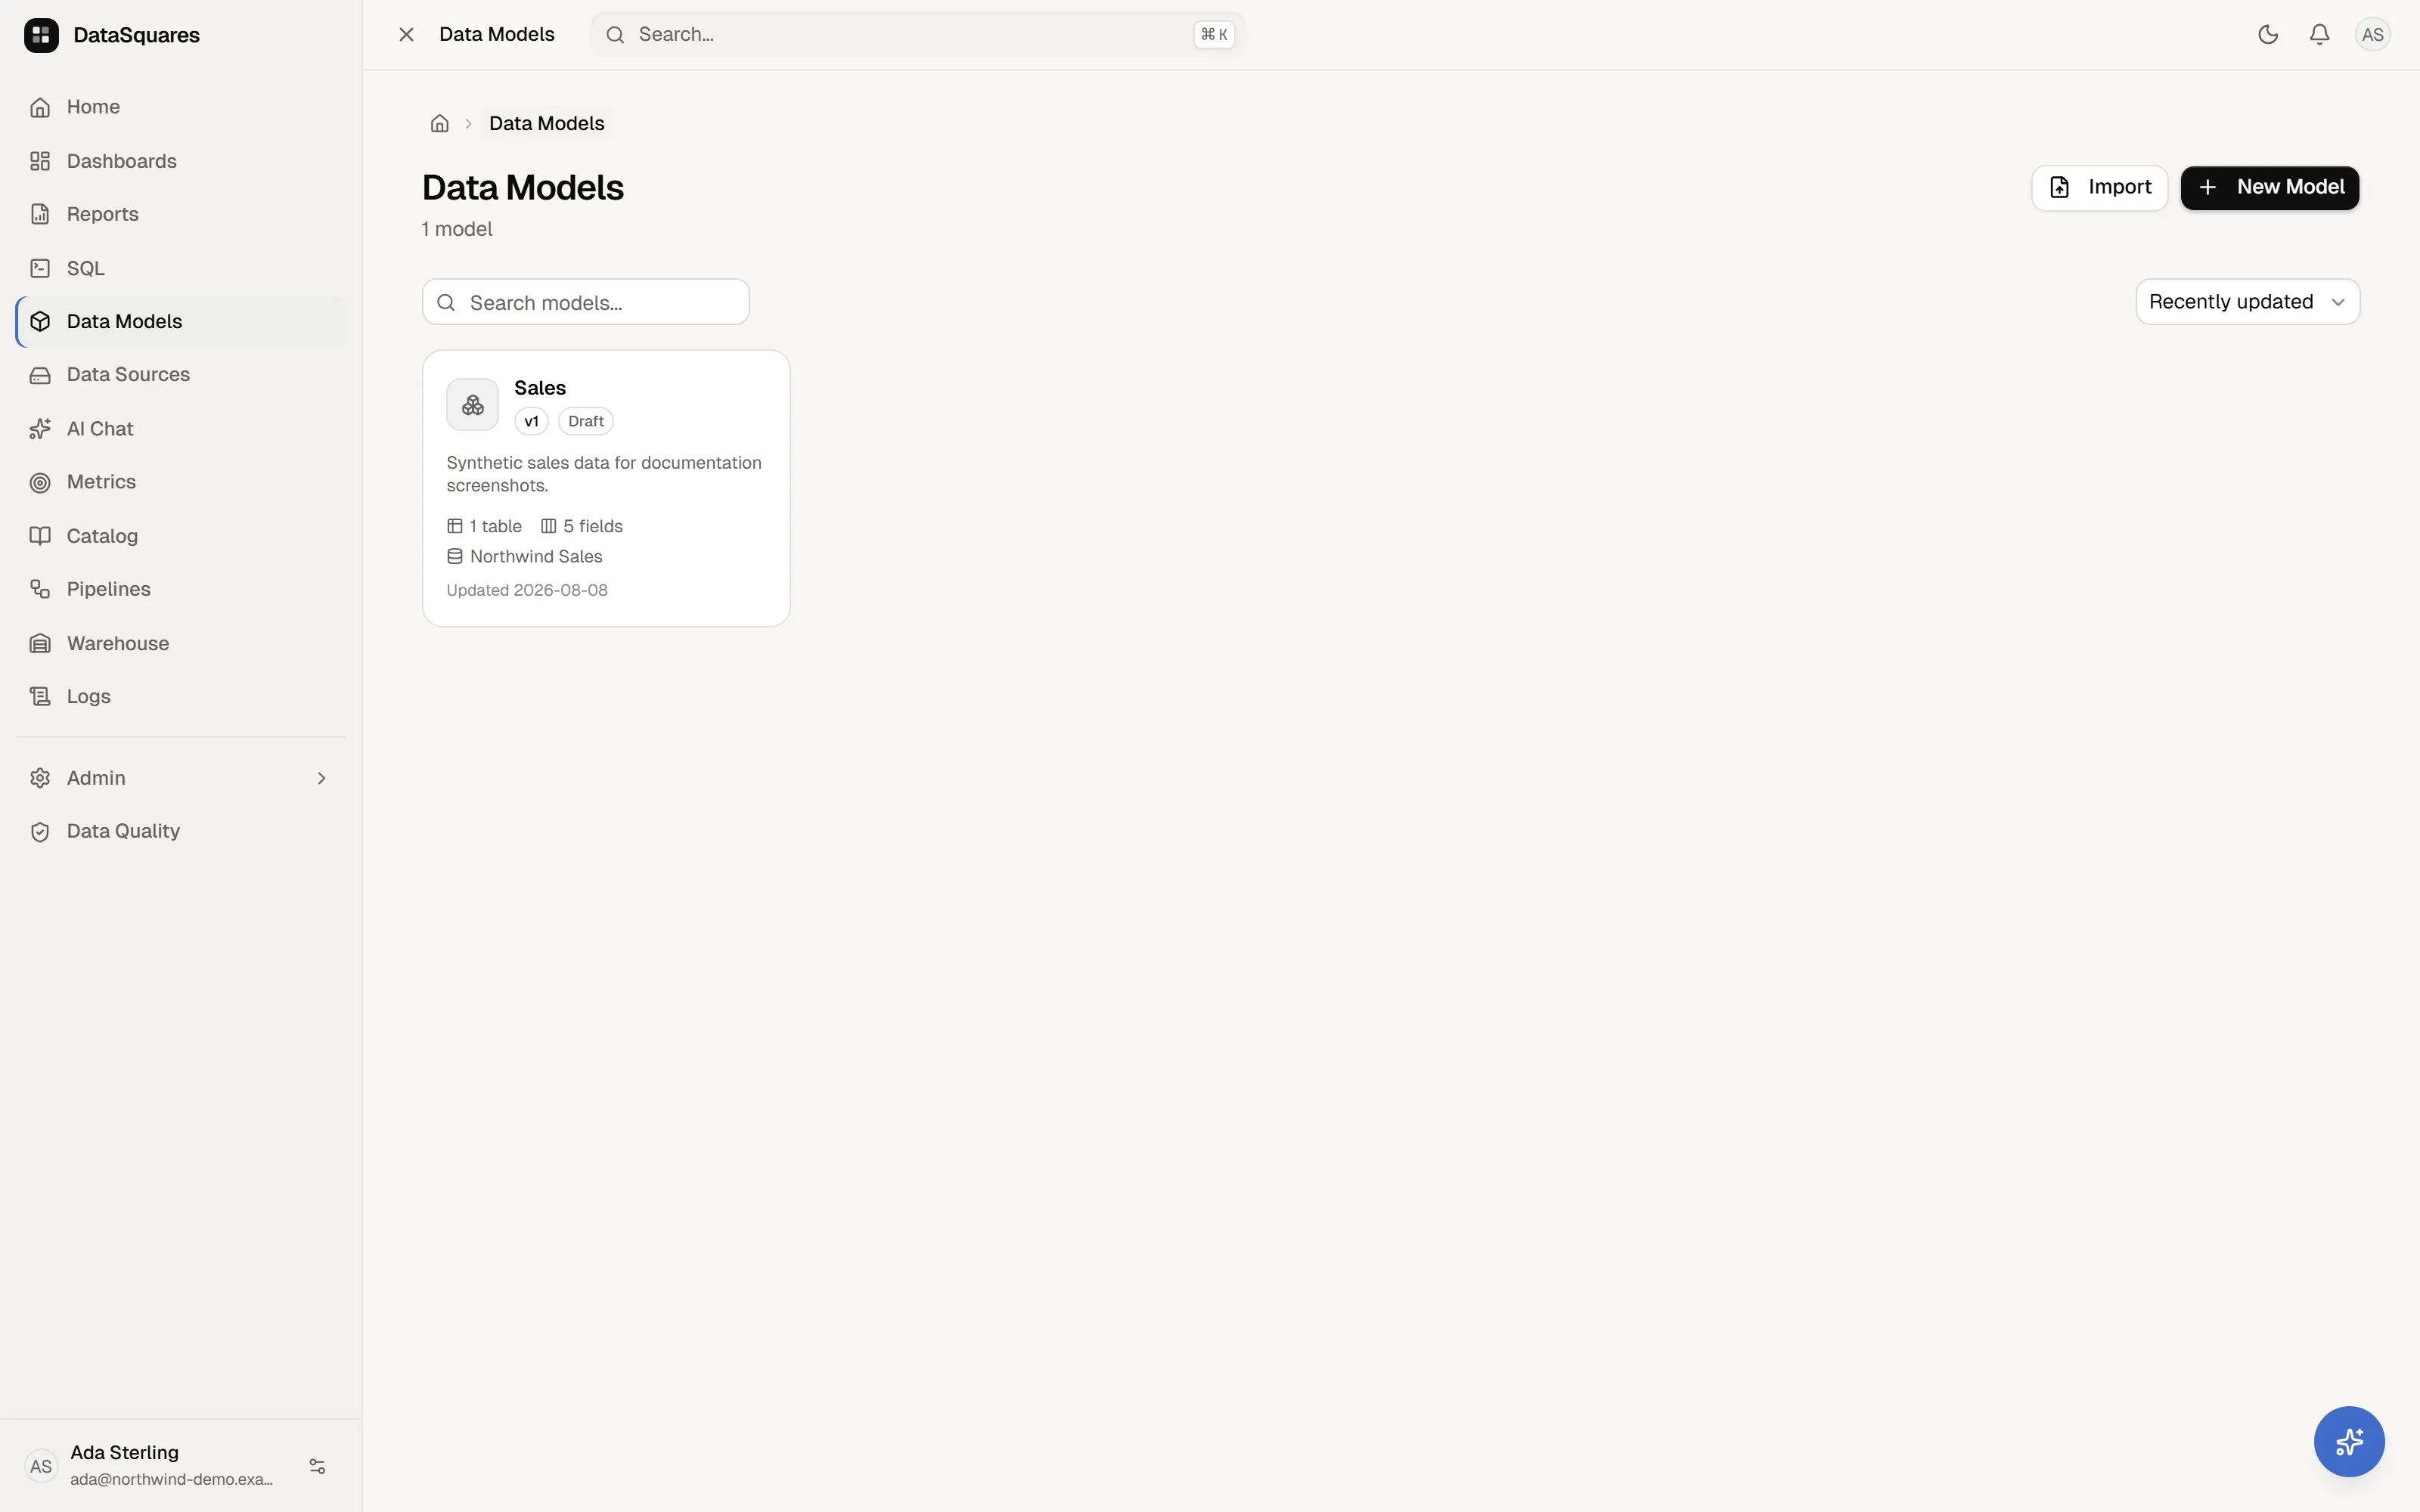
Create and manage models
Section titled “Create and manage models”From Data Models (/models):
- Model Hub: Browse all workspace models with responsive server-side search, sorting (
recent,name,tables), and pagination. - New Model: Name your model, bind it to a data source (each model binds to exactly one SQL or Warehouse-managed source), and provide an optional description.
- Model Selector & Renaming: Switch between models on the canvas using the header dropdown or rename an existing model directly via Rename.
- Model Blends: Access the Blends workspace (
/blends) from the model toolbar to join tables across different data models. - Import & Export Definitions (ALM): Export complete model definitions as portable JSON files or import definitions directly into the workspace to replicate semantic models across environments.
Import tables & schema discovery
Section titled “Import tables & schema discovery”- Import Tables: In the model editor toolbar, click Import Tables. Select a schema to list its tables along with estimated row counts (
~120,000 rows). - Schema discovery: If the source has not been profiled yet or schemas are missing, click Run Schema Discovery. Discovery runs as an asynchronous background job with live polling.
- Table selection: Check the tables you need (or click Select All) and click Import to bring them onto the canvas as interactive nodes.
Visual relationship canvas
Section titled “Visual relationship canvas”The model editor provides an interactive canvas powered by @xyflow/react:
- Table nodes: Display table names, column lists, and data types, highlighting primary keys (
PK) and foreign keys (FK). - Drag-to-connect: Drag a connection line between two tables (or specific fields) to open the Define relationship dialog.
- Relationship edge selector: Click an existing edge to change its cardinality or delete the relationship. Deleting warns you that charts joining through those tables will stop combining them.
Defining relationships
Section titled “Defining relationships”When creating or modifying a relationship, configure:
- Source & target columns: Join keys must be plain, visible physical source columns (calculated fields and hidden columns are excluded).
- Cardinality:
1:1(One-to-one)1:N(One-to-many)N:M(Many-to-many)
- Join type:
Inner,Left,Right, orFull.
Data viewer (Inspect rows)
Section titled “Data viewer (Inspect rows)”Double-click any table node on the canvas (or click View data in the toolbar) to open the Data Viewer:
- Fail-closed RLS: Previews run through the authenticated
/api/queryengine with row-level security enforced. - Row limit selection: Choose between 100, 500, or 1,000 rows.
- Server-side column filtering: Filter by column with operators (
contains,=,≠,>,<,is empty,is set). - Client-side instant search & sort: Search across loaded rows and sort any column with windowed rendering.
Sync schema
Section titled “Sync schema”When upstream database schemas change, click Sync Schema on the toolbar:
- Re-reads table structures and detects added columns, altered types, and dropped fields.
- Preserves existing relationships, measures, and calculated fields while updating physical column definitions.
Hierarchies
Section titled “Hierarchies”Click Add Hierarchy to define multi-level drill paths on a table (e.g. Region → City → Store or Category → Subcategory → SKU). Charts on the model automatically enable drill-down navigation along these paths.
Measures & calculated fields
Section titled “Measures & calculated fields”- Calculated fields: Define row-level column expressions directly inside table field configurations.
- SquareX measures: Click Measures (
ƒx) in the toolbar to open the SquareX measure builder for model-level, filter-aware calculations.
Row-level security (RLS)
Section titled “Row-level security (RLS)”Click Security to configure structural row-level security:
- Per-table policies: Add a policy with a SQL condition (e.g.,
region = 'US'ordept_id IN (1, 2)). - Fail-closed enforcement: RLS is injected at the database query planner level beneath every chart, export, drill-down, and data viewer query. It can never be bypassed by dashboard filters or measures.
- Policy management: List and remove policies as access rules evolve.
Version history & atomic restore
Section titled “Version history & atomic restore”Click Publish to release the current draft to dashboards, bumping the version number and creating an immutable snapshot.
- Quality gate validation: Before publishing, the model editor validates all defined relationships, join keys, and calculated expressions to prevent deploying broken queries or orphaned field references.
- Version history: Inspect previous published versions with timestamps, version numbers, table counts, and field counts.
- Atomic restore: Restores a snapshot in place in a single database transaction. All persistent field IDs remain unchanged so connected dashboard cards, filters, and data quality tests stay attached without breaking.
Related
Section titled “Related”- Joins & fan-out — cardinality mechanics and preventing fan-out errors.
- Calculated fields — row-level expressions on table columns.
- SquareX measures — aggregate measure expressions and context transitions.
- Data quality — test suites and AI relationship suggestions on top of data models.
- Saved queries — using model bindings inside saved SQL queries.