Presentations
Export a PDF, a picture or a PowerPoint file
An export is a file of the deck as one person sees it: a PDF of its slides, one slide as a PNG, or a PowerPoint file you can go on editing. It is made in the background from the figures computed once for you, with your access, and checked before anything is drawn. Every file says where its figures come from and whose access they show, and the export writes a record of exactly the values in the file.
A downloaded file is a snapshot: its values are those of the moment it was exported, and it says so on every slide or page. To bring it up to date, export again.
What you can export
Section titled “What you can export”| Format | What it holds |
|---|---|
| Slides — one slide a page, the page the deck’s page size; Slides with notes — each slide with its speaker notes beneath it; Handouts — 1, 2, 3, 4 or 6 slides a portrait page | |
| This slide as a picture (PNG) | The slide you are on, with its sources beneath it |
| PowerPoint (.pptx) | Every slide that is not hidden, each with its notes, as objects you can edit |
Either the saved draft (the default) or the published version. Hidden slides are left out of a PDF and a PowerPoint file; a deck with no slide to show can’t be exported, and says so. Exporting needs edit access to the deck.
Export from the editor
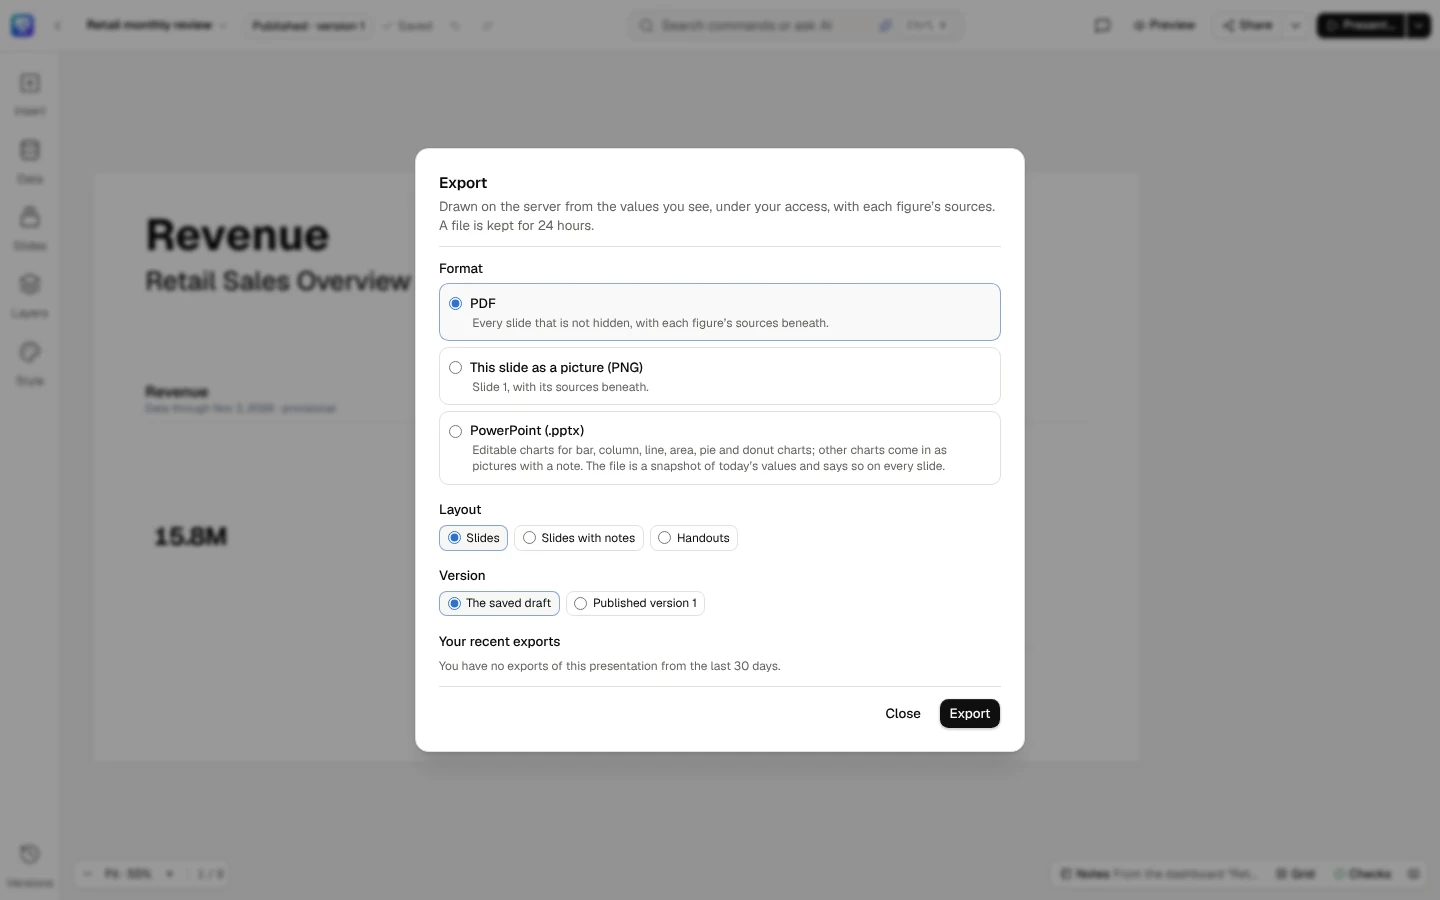
Section titled “Export from the editor”- In the editor’s top bar, open Share…’s arrow (More sharing actions) and choose Export a file…. Its editors and owner see it.
- Choose the format. For a PDF, choose its layout, and for handouts how many slides a page.
- If the deck is published, choose The saved draft or Published version n. Exporting the draft saves your latest changes first, so the file is what you see.
- Select Export. The dialog follows the export as it runs: Waiting, then Drawing with the pages drawn so far, then Ready. Select Download to save the file, or Cancel export to stop one still running.
If a finding that must be fixed is open, the export is Refused: the dialog lists those findings, each with Go to slide to take you to it. An export can also have Failed (with the reason; export again), been Cancelled, Expired after its 24 hours, or been Revoked because your access changed (see below).
Under the choices, Your recent exports lists the exports you made of this deck, newest first, 20, 50 or 100 a page, with Download for those still ready and Cancel for those still running.
Export a file… makes a PDF (slides, slides with notes, or handouts), this slide as a picture (PNG), or a PowerPoint file, and lists your recent exports.
PowerPoint
Section titled “PowerPoint”The file’s slides are the presentation’s page size (widescreen 16:9, standard 4:3, A4 or a phone story; see Resize a deck), in its look: its background, its master’s rules, logo, footer and slide numbers (with the style parts changed on a slide or every slide), and every element as a PowerPoint object.
- Charts. Bar, column, stacked bar, 100% stacked bar, line, area, stacked area, 100% stacked area, pie and donut charts come in as native, editable charts, their data in the chart’s own worksheet, in the deck’s series colours, with the value axis as the deck draws it; values in lakhs and crores are grouped as the deck writes them (1,23,45,678), and charts in lakhs and crores show their values in full in PowerPoint. Other kinds — treemap, waterfall, heatmap, funnel, map, Pareto and lollipop — come in as a picture of the chart, and so does a chart that draws what PowerPoint’s charts can’t keep (a plan outlined or a forecast hatched, a period to date, a forecast’s range, values indexed to a base, a log axis). That slide’s notes say so — Revenue by region is a picture: PowerPoint has no native waterfall chart. Its values are listed below. — and list every value. A chart with more than 25 members of a breakdown comes in as the deck draws it, the 20 largest and Other (see Broken down by), in the PDF and the pictures too.
- Annotations. A chart’s annotations are drawn over a native chart as shapes and text, lined up with its bars, each with its spoken description as alt text; a chart drawn as a picture holds them.
- Text. Each text box sits where it is on the slide, in the deck’s font, at the size the editor fits it to and with the editor’s line breaks. A box with a format of its own keeps it: its font and weight, size, line spacing (on each paragraph) and letter spacing (on its words, never between Arabic letters, which stay joined). A face between Regular and Bold is named by its own name, such as Montserrat SemiBold, and a weight the font lacks by its nearest face. Live numbers are their values, period tokens their period and figures entered by hand keep their †. The font is named, not embedded: with the deck’s font installed (Geist, Geist Mono, Newsreader, Fraunces, Bricolage Grotesque, Inter, Lora, Playfair Display, Montserrat, DM Sans, Space Grotesk, Source Serif 4, Merriweather, Work Sans, Plus Jakarta Sans, IBM Plex Sans, Manrope, Noto Sans Arabic or Noto Sans Hebrew, each under the SIL Open Font License) every line breaks where the editor breaks it; without it, PowerPoint uses a substitute, and its boxes shrink their text to fit.
- Right-to-left text. A paragraph that runs right to left is marked so, aligned as in the editor, with its list’s indent and markers at the right; PowerPoint orders its line itself. Its Arabic or Hebrew letters name Noto Sans Arabic or Noto Sans Hebrew as their font (PowerPoint’s font for complex scripts) when the deck’s font has none of them: installed, they show as in the editor. A native chart’s labels are PowerPoint’s to draw. See Right-to-left text.
- KPI tiles, tables, pictures and shapes. A KPI tile is its card, value, label and comparison; a table is a PowerPoint table, a cut one still saying Top 10 of 512 beneath it; pictures keep their crop and alt text, and charts their alt text; shapes, lines and icons are drawn as they are. A picture’s options are PowerPoint’s own picture settings where it has them (crop, turn, flips, shape, opacity, shadow); its colours are applied to the picture itself and its border is an outline over it. On a faded picture the border is drawn around the picture rather than over it, so the two fade as one, as the editor fades them: the picture’s crop leaves out the strip under the border, and PowerPoint’s Crop brings it back.
- Notes. Each slide’s notes hold its speaker notes, with their live numbers as exported; then Sources — each figure’s source, period, how complete its data is, how your access narrowed it, what has no value and why, and every figure entered by hand; then the record: Values as exported 26 Oct 2026, 14:05 IST by Priya Raman, with Priya Raman’s access · record …. The record’s values are exactly the file’s.
The snapshot stamp
Section titled “The snapshot stamp”Every downloaded file says it is a snapshot:
- PowerPoint: a stamp at the foot of every slide — Data through 30 Sep 2026 · exported 26 Oct 2026 by Priya Raman, Prepared with Priya Raman’s access, the link to the live presentation and a QR code of the same link. The date is the oldest data time among the slide’s figures, in the deck’s time zone; it says completeness unknown where a figure has no data time, and only Exported 26 Oct 2026 by Priya Raman on a slide without figures. The stamp is a group named Snapshot stamp in PowerPoint’s selection pane, drawn over the slide’s foot: where it covers the foot of an element, the export’s warnings and that slide’s notes say so (The snapshot stamp covers the foot of Chart 1), and you can move or delete the group. The file’s title and subject say it is a snapshot too.
- PDF: every page’s notes band carries the same line, the link and the QR code, beside the access stamp.
- PNG: the picture stays a picture of the slide; the same words are in its metadata, as its description.
The link and the QR code open the presentation in DataSquares for whoever signs in, with their own access. They are never a token, and show nothing to anyone who can’t sign in.
A frozen deck’s export
Section titled “A frozen deck’s export”Exporting the published version of a deck frozen for a meeting draws the values it was frozen with when your access is the access that froze them: the stamp begins Frozen 5 Oct 2026 for Board meeting, and the export’s record holds the frozen values with when they were frozen. Anyone else’s export of it draws live values read with their own access, and its stamp begins Live values: this presentation was frozen with access different from Priya Raman’s. The draft is always exported live.
What every PDF page and PNG carries
Section titled “What every PDF page and PNG carries”- Source notes: for each figure on the page, its source, its period, how complete its data is, how your access narrowed it (EMEA only), what has no value and why, and every figure entered by hand with its †.
- The access stamp: Prepared with …’s access, naming the person who exported it and when, so anyone the file is forwarded to knows whose figures they are reading.
The slides are drawn in the deck’s font, measured as the checks measure them: text that would overflow its frame in the file is a Review finding (L2) you see in the editor before you export. A text box with a format of its own is drawn in its font (embedded in the PDF), weight, size, line spacing and letter spacing, as the editor shows it; a weight its font lacks is drawn in the font’s nearest face. Source Serif 4 italic figures can fit a hair differently on Windows than in the PDF. Windows sets the italic 3 slightly wider at 400 and narrower at 500, so a line of italic numbers may break at another word. Letter spacing never parts Arabic letters: it widens only the spaces between Arabic words and the Latin letters beside them. Arabic and Hebrew are shaped in Noto Sans Arabic and Noto Sans Hebrew and ordered as in the editor, and a right-to-left line’s words are what the PDF’s text reads; a chart’s Arabic or Hebrew labels are drawn as outlines, which the PDF can’t select or search (the chart’s alt text says them). See Right-to-left text.
A sources slide whose list is longer than the slide holds is drawn as many pages as it needs, at the list’s own text size, each named for its slide (Slide 12 (2 of 3)): every page in a PDF and in a PowerPoint file; a PNG of the slide is its first page. The checks measure the list on every page.
A PNG or JPEG picture with options is drawn as the editor shows it. A photo whose file says it is to be turned (as phones write one taken on its side) is turned as the editor and your browser show it, in every export; PowerPoint turns it by the picture’s own rotation. A picture without options fills its frame, in PowerPoint too: in a frame stretched to another shape than the picture, the part that doesn’t fit is cut off, where the editor shows the whole picture. A WebP picture is a box that says so in every export, PowerPoint included: replace it with a PNG or JPEG. So is a picture of more than 40 megapixels (an 8000 × 6000 photo is 48), which the editor shows but the exports don’t draw: replace it with a smaller copy.
Checked before it is drawn
Section titled “Checked before it is drawn”The export runs every check on the figures it is about to draw. While a finding that must be fixed is open, the export is refused and lists the findings, as the publish dialog does: fix them and export again. See How the checks work. The two checks that compare with more than the slide holds (C8 and C18) only ever ask for a review, so an export doesn’t run them: they run in the editor’s Checks panel and the publish dialog.
Export through the API
Section titled “Export through the API”Exports can also be made through the REST API, with your own session or an API key with write
access (the write or presentations:write scope). A key never does more than its owner may.
POST /api/presentations/{id}/exportswith{"format": "pdf", "layout": "slides"}— or"layout": "notes", or"layout": "handouts", "perPage": 4, or{"format": "png", "slideId": "…"}for one slide, or{"format": "pptx"}for a PowerPoint file (which takes no layout,perPageorslideId). Add"revision": {"version": 4}to export a published version. It answers202with the export.GET /api/presentations/{id}/exports/{exportId}until itsstatusissucceeded(orrefused, with itsfindings); while it runs,pagessays how many pages it has drawn.GET /api/presentations/{id}/exportslists your exports of the deck, 20, 50 or 100 a page.GET /api/presentations/{id}/exports/{exportId}/downloadreturns the file.POST …/cancelstops an export still running.
An export is yours alone: nobody else lists or downloads it.
Limits, and why they are there
Section titled “Limits, and why they are there”- A file is kept for 24 hours. Download it within a day; after that, export again.
- Your access is checked again at download. If your membership of the workspace or your access to the deck’s figures has changed since the export was made, the download is refused, the export is revoked, and you are asked to export again under your current access. A file never outlives the access that made it.
- Exports run a few at a time. You can have 2 exports in progress, a workspace 3, and a workspace makes up to 100 in 24 hours; past that an export is refused with the reason, and the ones you made are still there to download.
- A file doesn’t update. Its values are those of its export, and it says so; export again for today’s.