Mobile app - library, search, metrics, reports and stories
The Library tab holds everything you can open: Dashboards, Reports, Stories, Metrics and Offline (copies kept on the phone, see Dashboards on the phone). You see the segments your role can open.
Dashboards
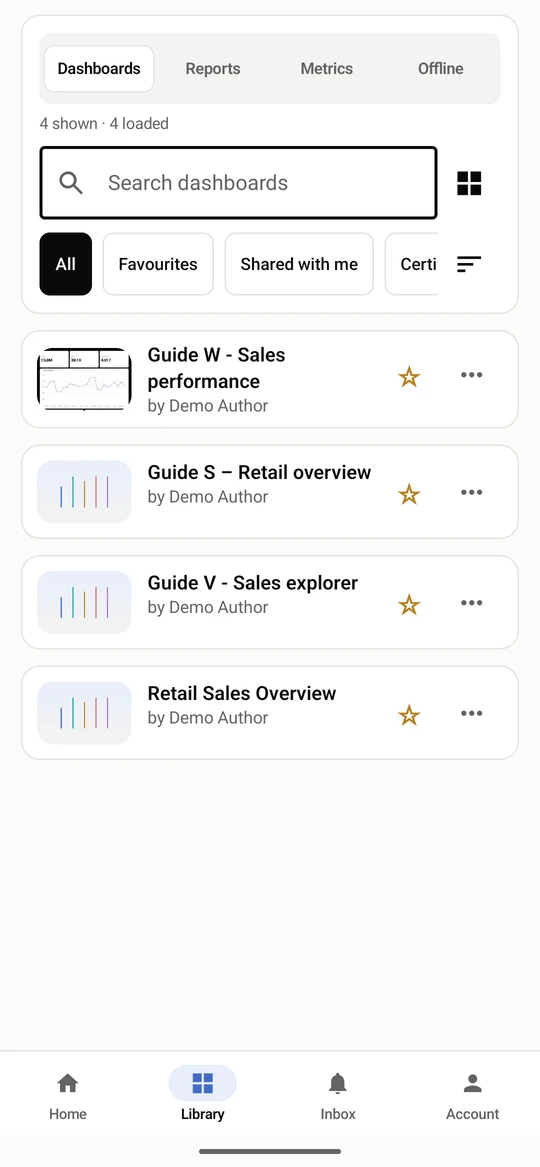
Section titled “Dashboards”Search by name, filter by Favourites, Shared with me or Certified, sort, and switch between cards and a list. The star favourites a dashboard; the three dots open more options.
Open the Library tab. The segments switch between Dashboards, Reports, Metrics and Offline.
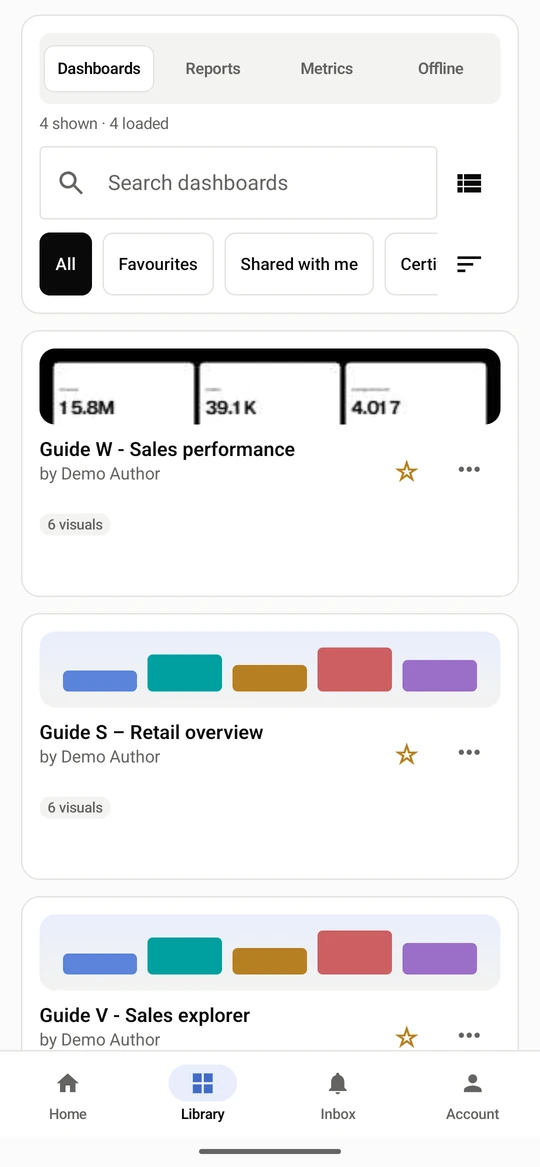
Type in Search dashboards to narrow the list.
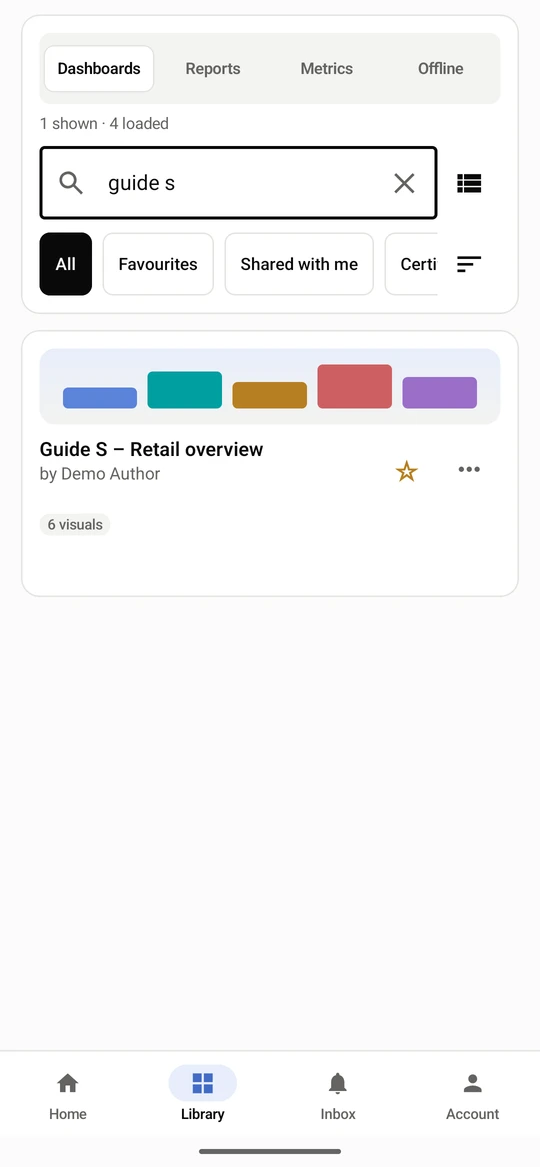
The sort button offers Recently viewed, Most opened, Recently updated, Name A-Z, Name Z-A and Owner.
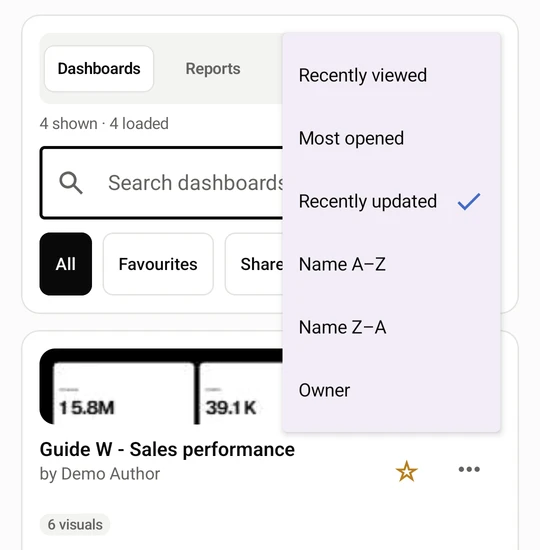
Switch between cards and a compact list with the view button beside the search box.
Search
Section titled “Search”Search looks across dashboards and metrics you can see. It opens with what was recently active.
Search opens with Recently active items, filtered by All, Dashboards or Metrics.
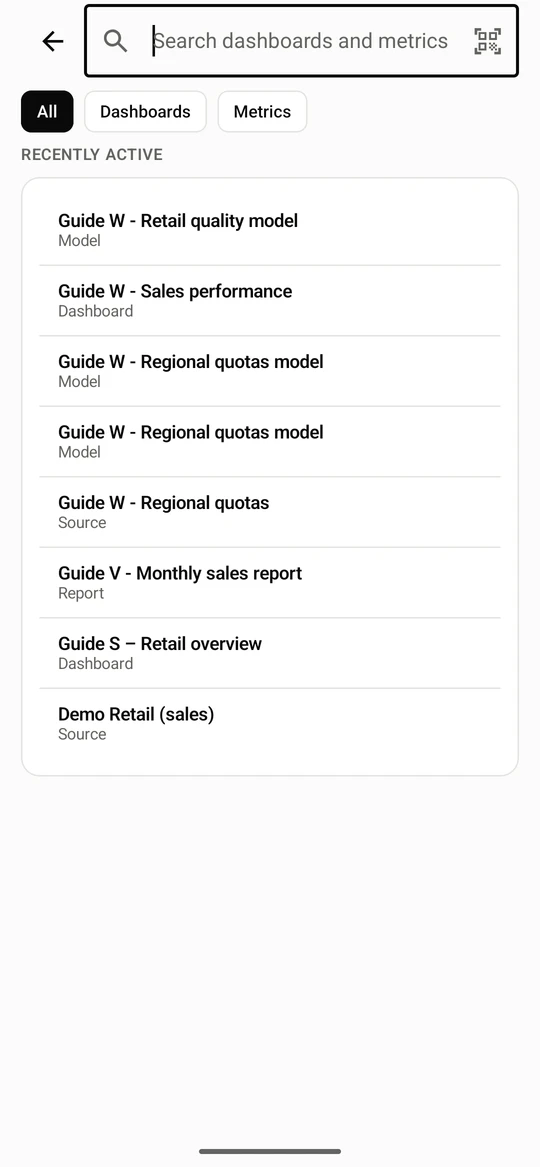
Type a query. Results are ranked, with dashboards and metrics grouped below. Tap one to open it.
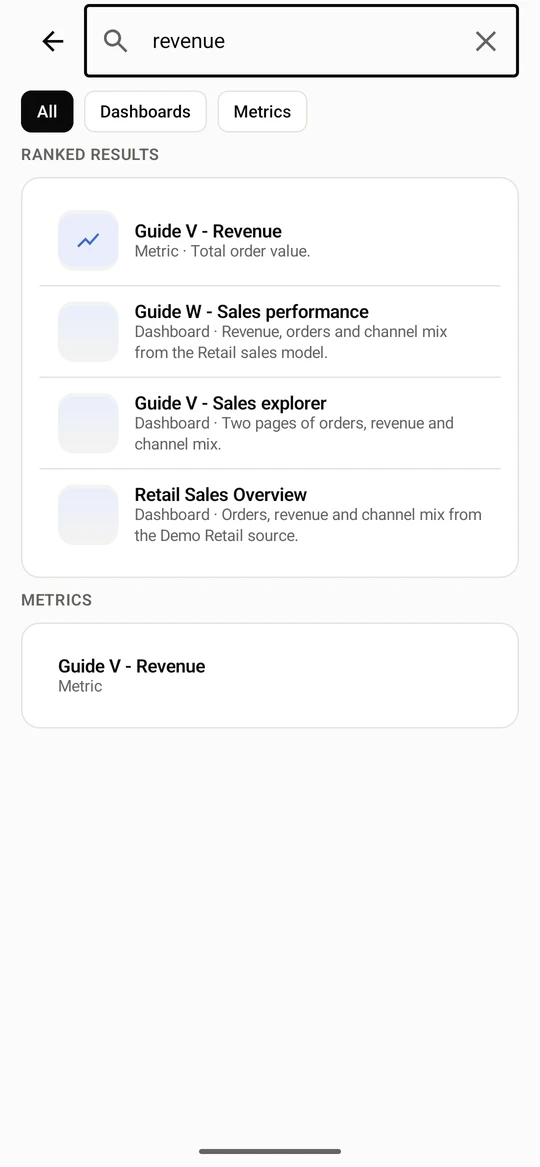
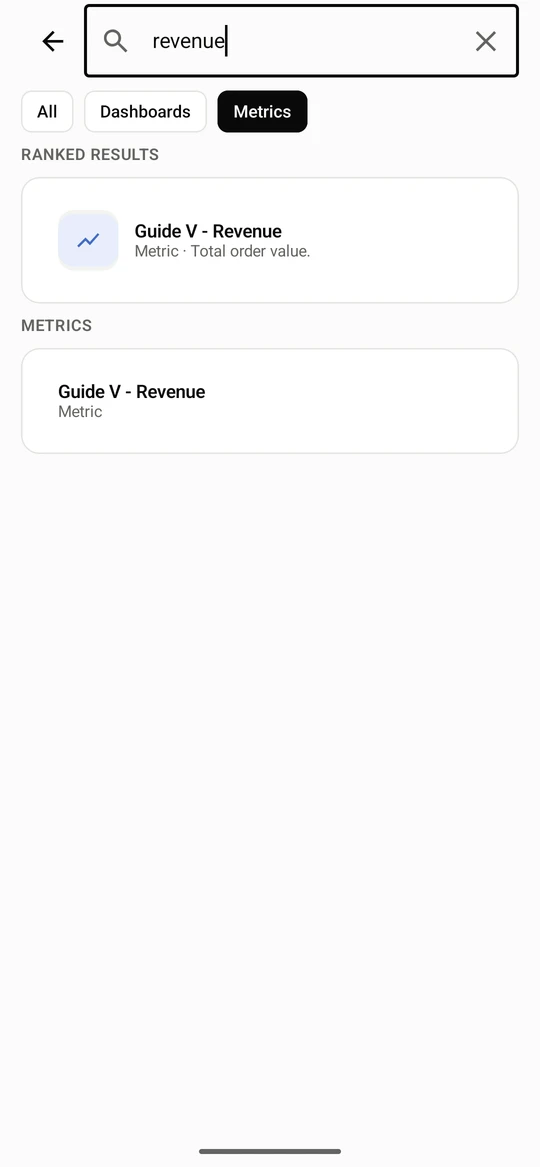
Choose Metrics to see only metrics.
Metrics
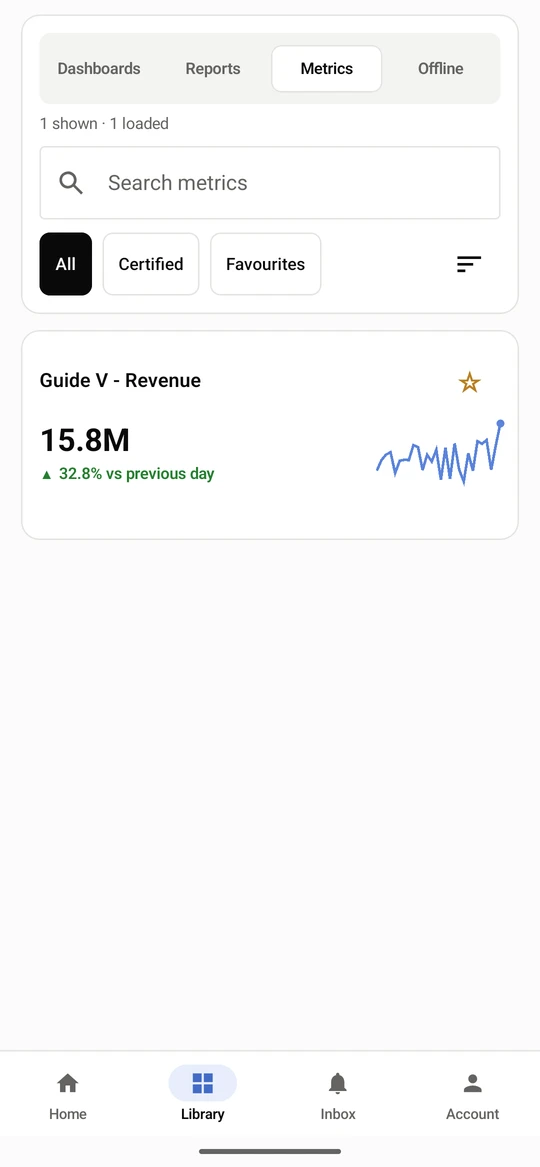
Section titled “Metrics”A metric is a governed number defined once (see Governed metrics). The list shows the value, the change and a small trend; a metric opens to a period and grain picker and its governance status.
Open Library, then Metrics. Each row shows the value and how it changed; the star adds it to your watchlist.
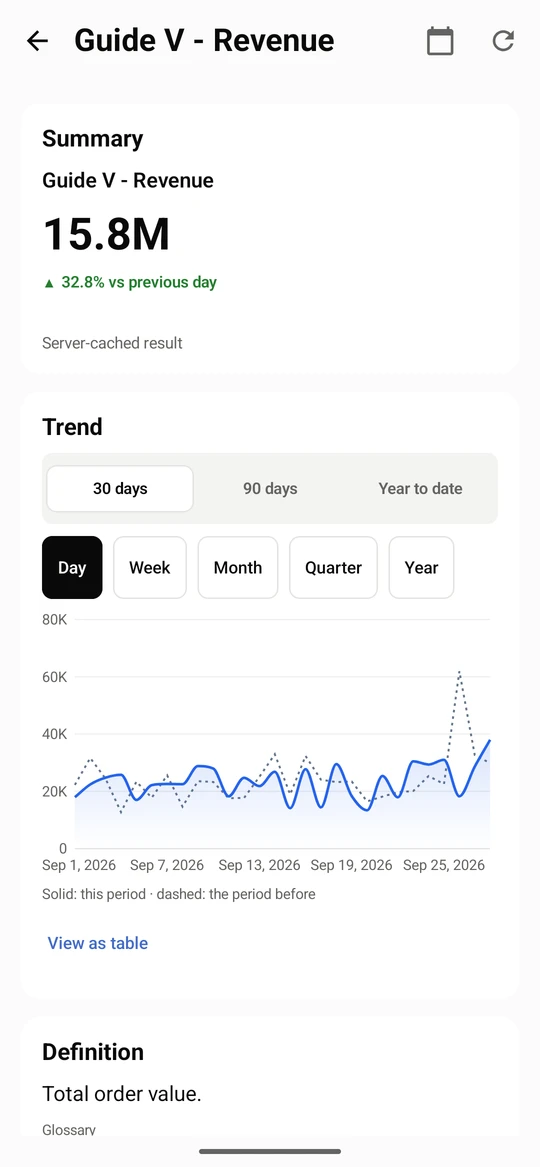
Open a metric for its summary and a trend chart. Choose 30 days, 90 days or Year to date, and the grain (Day, Week, Month).
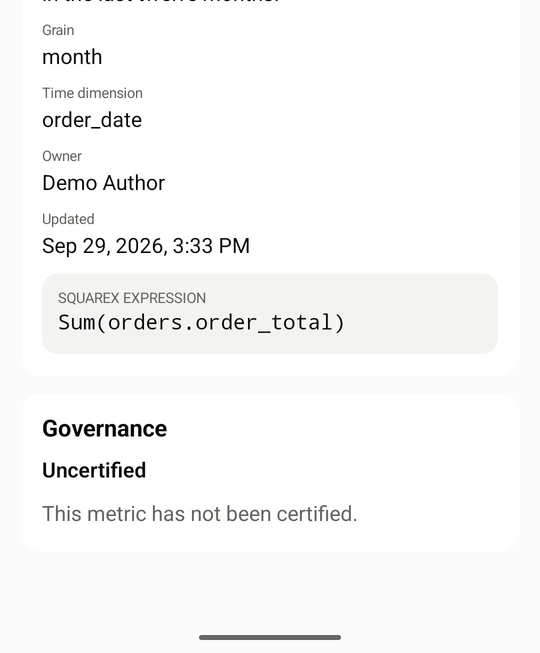
Further down are the grain, the time dimension, the owner, the metric expression and the Governance status (Certified or not).
Reports
Section titled “Reports”Reports are drawn on the server for your account (the same renderer as scheduled delivery, see Reports) and shown as pages.
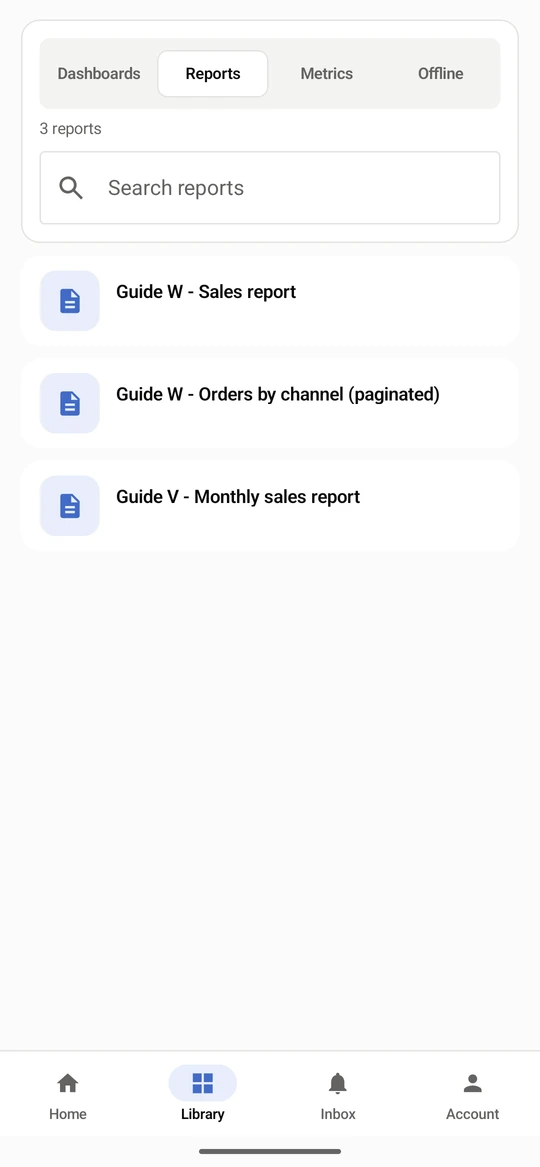
Open Library, then Reports. Search by name; each row says whether it is a report or a paginated report.
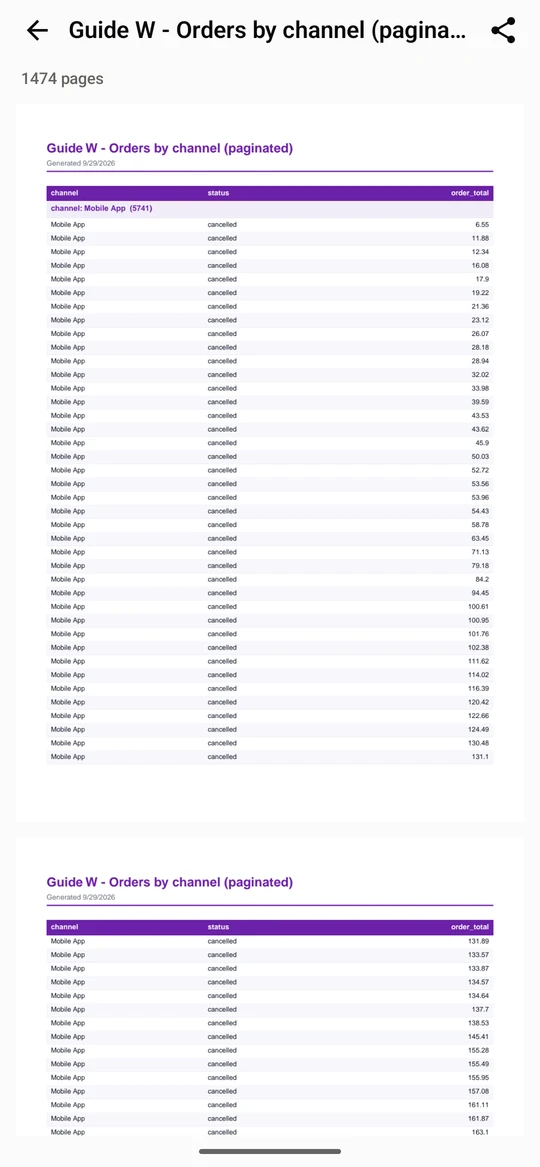
Open a report. The server draws it as pages for your account and the count shows under the title. Share report sends the file.
Stories
Section titled “Stories”Stories lists the stories you may read — published ones your role can view, and any shared with you — newest first, with a search. A story opens on the phone as it reads on the web: its sections, text, lists, panels, toggles, tables and images, with charts drawn natively and live numbers in the text. Every chart and number runs with your own access: a number your access leaves out shows a dash, and a section that follows data access is not shown (the story says how many are hidden). A snapshot story says when its data was kept.
- The speech bubble opens the story’s comments: read the thread, reply, or add your own.
- The bell follows the story. New versions and comments then arrive in your Inbox — the app checks about every 15 minutes — and as a phone notification if Settings → Notifications → Stories you follow is on.
- A notification or a link to a story (
https://app.datasquares.ai/stories/…) opens it in the app.