Catalog: certification & glossary
The governance tools that answer “can I trust this, and who is allowed to see it?” — asset certification (which of the many dashboards/models/metrics is the blessed one), the business glossary (what your organization’s terms actually mean), the lineage graph (what feeds this, and what breaks if I change it), and field sensitivity labels (what gets masked, for whom).
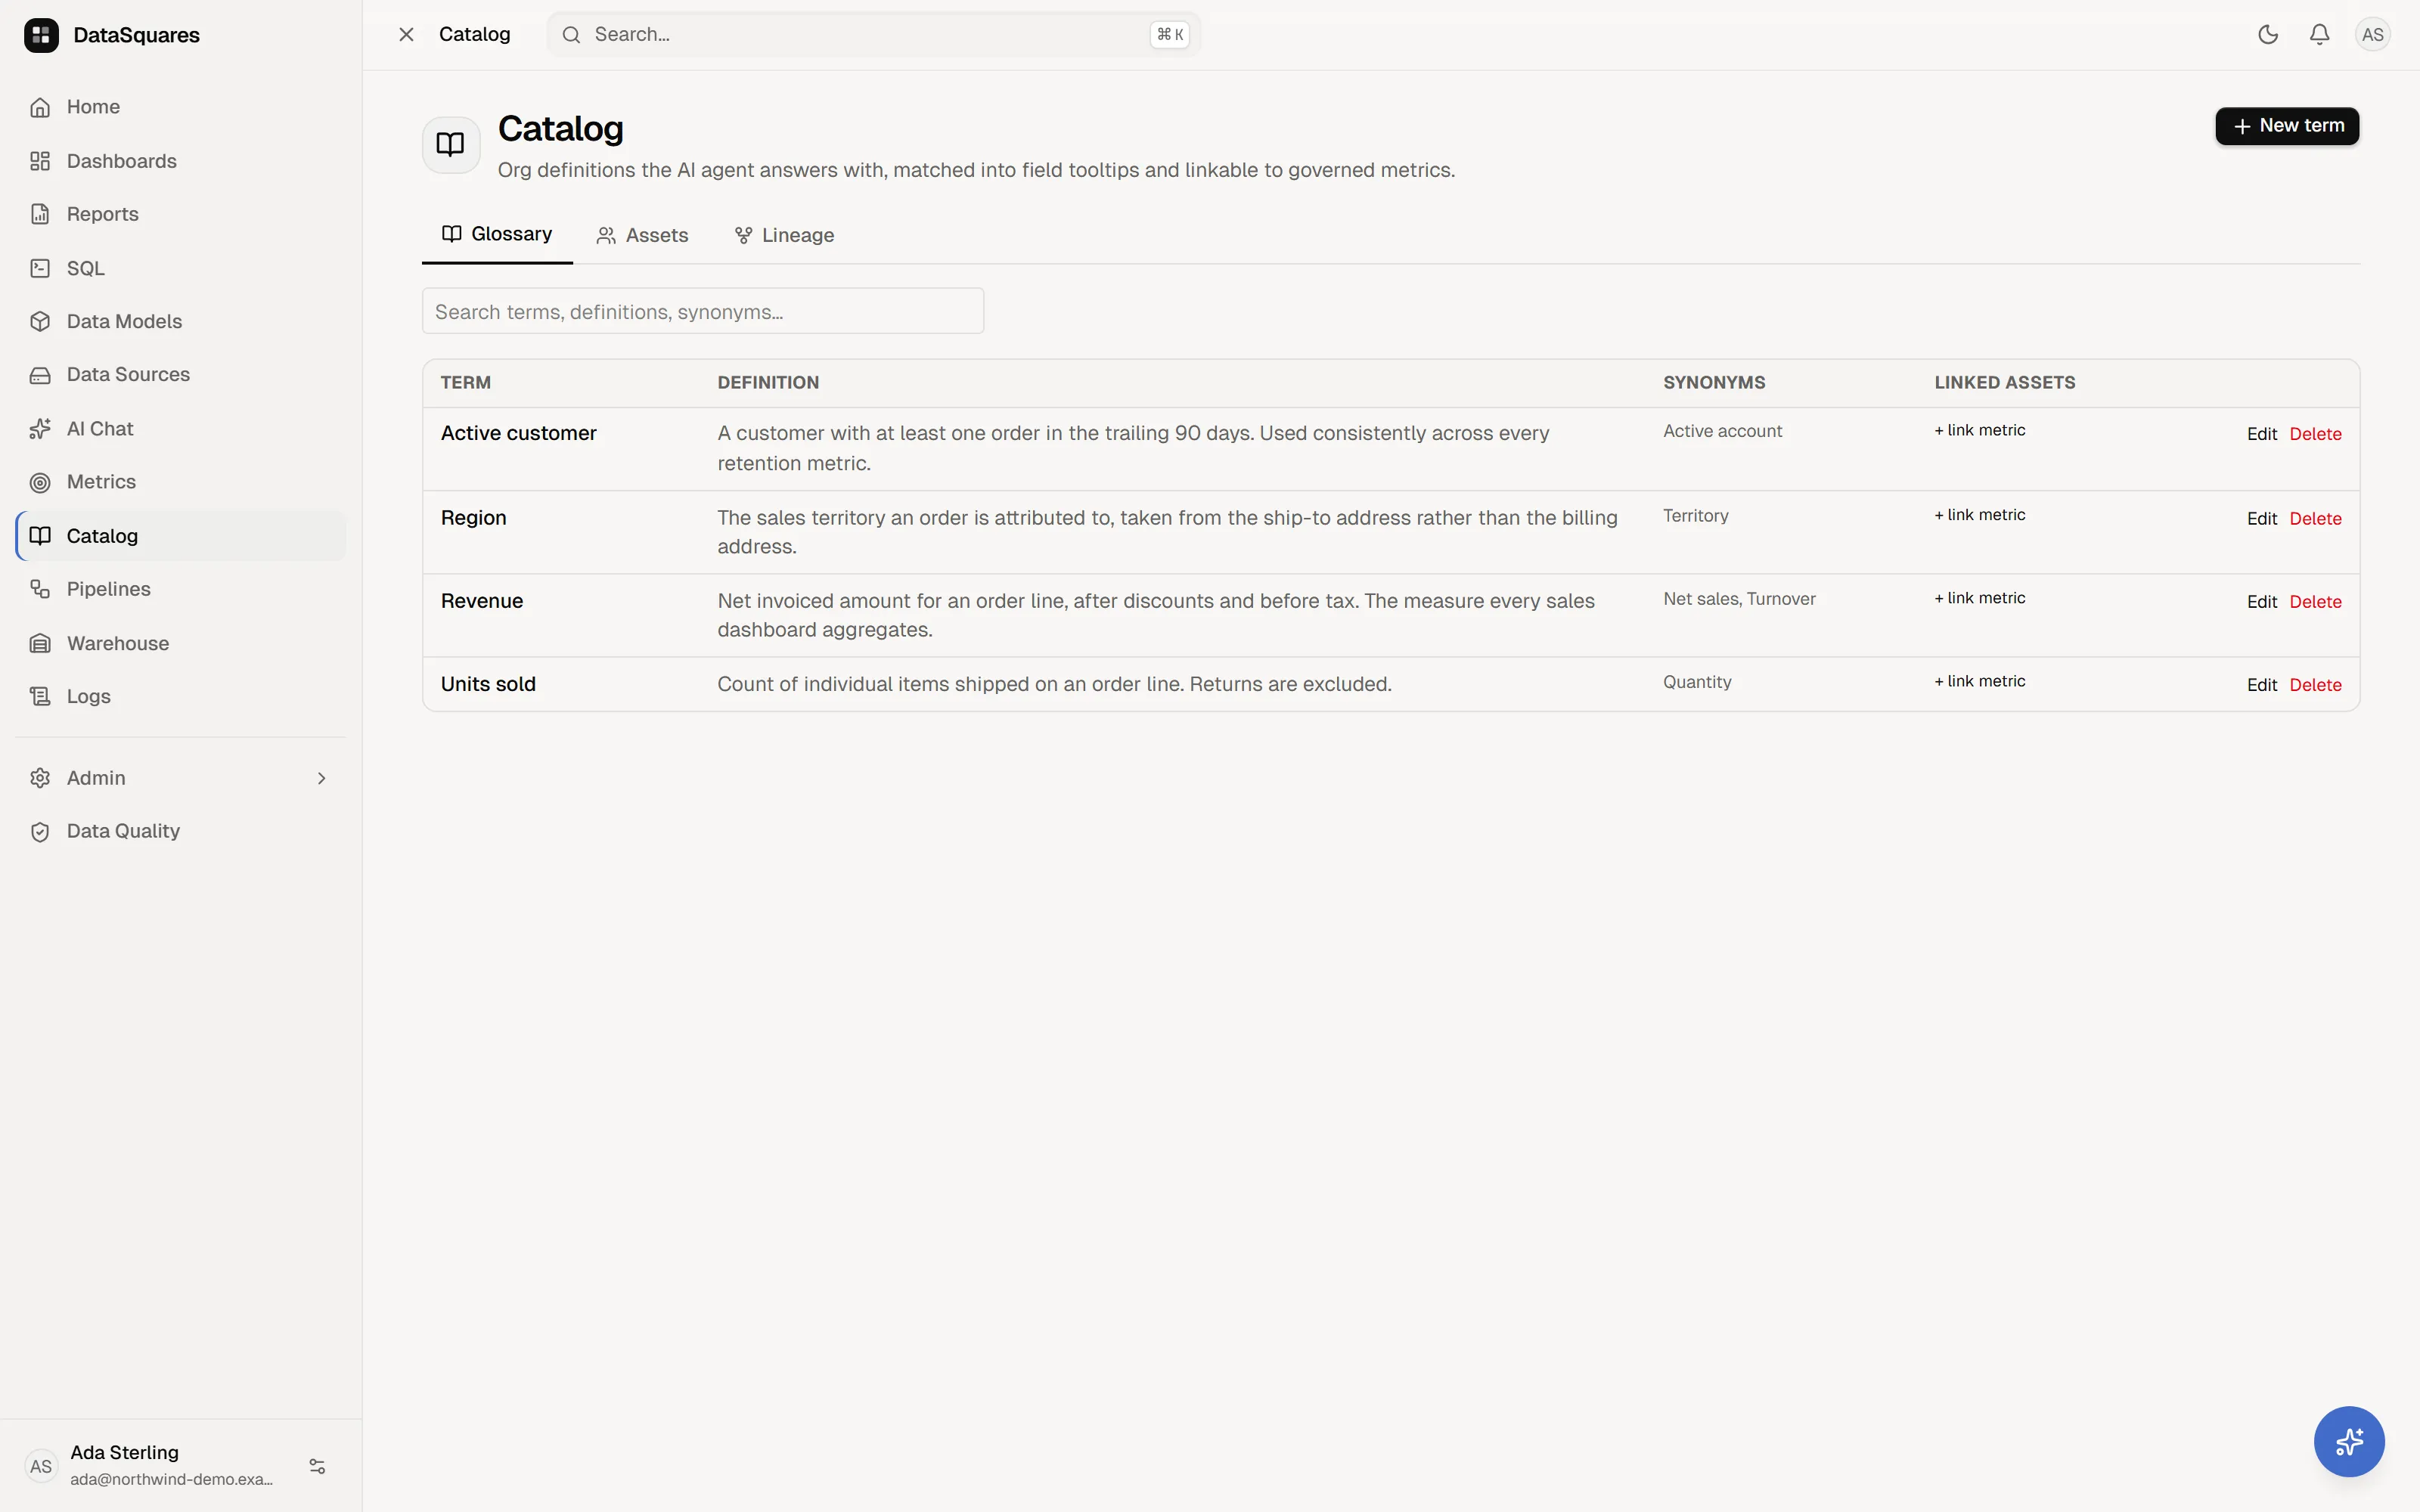
The Catalog page has three tabs: Glossary, Assets, and Lineage.
Certification
Section titled “Certification”Workspace admins can certify four asset types: dashboards, data models, data sources, and metrics. Certification is a governance act, deliberately separate from authorship — the badge says “this one is endorsed”, not “I made this”.
What certification does:
- A green ✓ certified badge appears wherever the asset shows — dashboard lists, source cards, the Metrics hub (with who certified it, when).
- Search ranks certified assets first, so the endorsed dashboard beats the seventeen experiments named “Revenue v2 final FINAL”.
- The AI agent and mobile apps surface certification too — certified-first ordering in the mobile metrics hub, certification visible to MCP clients.
Certify or uncertify from the asset’s own surface (e.g. the Metrics hub row actions) — admins only. The API supports dashboards, models, sources, and metrics. The Metrics action is currently rendered for every viewer and relies on the API to reject non-admin attempts.
Business glossary
Section titled “Business glossary”Under Catalog → Glossary, define your organization’s terms:
| Field | Meaning |
|---|---|
| Term | the word or phrase (e.g. “Active customer”) |
| Definition | the org’s real rule — the AI agent answers with this wording |
| Synonyms | comma-separated alternates, matched in questions and field names |
Terms can be linked to the assets that implement them — governed metrics, model fields, or models — so the definition and the implementation stay attached.
The current Catalog UI can add links to metrics and remove any link already
on a term. The API also accepts model and model_field links, but there is no
model/field picker for creating those two link types in the web UI yet.
Terms are unique per workspace. A term is limited to 120 characters, its definition to 4,000, and it can have at most 12 synonyms of 120 characters each. Deleting is a soft delete; the AI stops receiving the term on subsequent requests.
Where glossary terms surface
Section titled “Where glossary terms surface”- AI chat — the agent’s context includes matched glossary definitions, so “how many active customers?” is answered using your definition of active, not a guess. (Deleting a term takes effect immediately.)
- Field tooltips — fields whose names match a term or synonym show the definition on hover, right in the field tree.
- Search — terms and synonyms improve discovery.
Ownership & domains
Section titled “Ownership & domains”The Assets tab lists dashboards, models, data sources and metrics together, each with an owner and a domain — so “who do I ask about this number?” has an answer that isn’t guesswork.
- Assign inline from the list. An owner must be a member of the workspace: ownership by someone who can’t act on it is responsibility nobody holds.
- Facets narrow the list by domain or owner. They’re computed over the whole set rather than over what you’ve already filtered to, so choosing one facet doesn’t make the others disappear.
- Unowned is a first-class view — the gap list, which is the one you actually want when starting a governance push.
Assignments are recorded in the audit log.
The Assets API returns at most 500 rows to the current UI (the endpoint accepts up to 1,000); the tab has facets rather than pagination. Facet counts describe the whole workspace, not only the currently filtered rows. If the asset list fails, the UI does not claim that the unowned count is zero. If the workspace member list fails, owner controls become read-only so a missing picker cannot silently clear an existing owner.
Lineage
Section titled “Lineage”The Catalog’s Lineage tab draws your whole workspace as a graph — “Trace any asset from source to share — click a node to see what feeds it and what breaks with it.”
It flows left to right through the workspace’s data path, including pipelines and warehouse datasets:
source → pipeline → warehouse dataset → model → query / metric → dashboard / report → share
The visual graph uses five layout columns, so some stages share a column: sources and pipelines; warehouse tables and models; queries and metrics; dashboards and reports; then shares.
Certified assets carry their check badge here too, so you can see at a glance whether the blessed model is the one actually feeding a dashboard.
Nothing is hand-maintained
Section titled “Nothing is hand-maintained”Every edge is derived from the real references, live, each time you open the tab. A pipeline points at the dataset it feeds; a model points at a source or dataset because that’s what it is built on; a dashboard points at a model because one of its cards queries that model; a share points at its dashboard. There is no asset-level lineage metadata to fill in and nothing to keep up to date — if you repoint a card, the graph changes with it.
Pipeline edges come from stored DAG steps. System pipelines are hidden. A
managed dataset is represented by its registered source node; a pipeline load
whose dataset is not registered yet appears as a synthetic warehouse: …
table node. Saved-query dependencies use their model when model-bound and their
source otherwise. Dashboard cards contribute model, saved-query, and
metric-bound edges; reports contribute model or source edges; only active
dashboard/report shares appear.
The corollary is that lineage only knows what the platform knows. A dependency expressed outside DataSquares — a view in your warehouse that quietly joins two tables, say — isn’t in the graph.
Impact analysis
Section titled “Impact analysis”Click any node and the graph scopes to that node’s connected closure — a scoped chip appears, and you’re looking at everything upstream that feeds the asset and everything downstream that breaks if you change it. That’s the whole point: run it before you rename a field, retire a model, or delete a source, and you’ll see the seventeen dashboards that were quietly depending on it. Clear the chip to go back to the full graph.
The arrow on a node opens its asset when a route exists. Metrics and saved
queries open their hub; synthetic warehouse-table and share nodes have no
detail link. Deep links can open a pre-scoped graph with
/catalog?tab=lineage&asset={node-id}. Unknown node IDs deliberately return an
empty graph instead of falling back to the whole workspace.
It also refuses deletes
Section titled “It also refuses deletes”The same graph is what stops you shooting yourself in the foot. Deleting a
Warehouse dataset that anything still references is refused —
the dialog reads "{name}" can't be deleted yet, followed by “These assets
still reference the dataset. Remove or repoint them first, then delete
again.” Every dependent is listed and linked, so you can go fix them. (The API
refuses the same delete with a 409 and the same list — see the
datasets API.)
Field sensitivity & masking
Section titled “Field sensitivity & masking”Any field in a data model can carry a sensitivity label — PII,
Confidential, whatever vocabulary your organization uses; it’s free text (up
to 50 characters). Labelling a field masks it. This is currently a model-field
API capability; the Catalog page does not provide a sensitivity-label editor.
The important part is where it’s enforced: masking happens in the query engine, not in a chart component. The label follows the data into every surface that queries the model — dashboards, exports, shares, embeds, AI chat, the MCP server — with no per-surface opt-in, and no way to undo it from the chart side.
What a masked user actually sees
Section titled “What a masked user actually sees”| Use of a labeled field | Result |
|---|---|
| As a dimension (axis, color, small multiples, tooltip) | values render as ***, but the chart keeps its shape — grouping still happens on the real column, so you get one bar per real value, just unnamed |
| As a value or aggregate (y-axis, bubble size) | refused |
| In a filter | refused |
| In a sort | refused |
The refusals are deliberate, and they are loud rather than quiet:
Field “Email” is labeled PII — filtering on it requires a privileged role. Remove the field or ask a workspace admin.
This is the design decision worth understanding. An average of a labeled column is still derived from the labeled data; filtering or sorting by a hidden value leaks it by inference (sort by salary, read the names off the axis). So rather than silently returning a wrong or misleading number, the query fails and tells you which field and which label stopped it.
SquareX measures over a table containing any labeled field are blocked for masked users too — compiled measure SQL references columns by name and can’t be selectively masked, so it fails closed. The block is scoped to the table with the labeled field, not the whole model, to keep the blast radius small.
Who sees clear values
Section titled “Who sees clear values”Workspace admins. Everyone else — members, support staff, and API-key callers — is masked, and a caller whose role can’t be determined is masked too (fail closed). Because the masked query is literally different SQL, it has a different cache key: a cached clear result can never be handed to a masked user.
Raw SQL and external egress
Section titled “Raw SQL and external egress”Raw SQL cannot be rewritten safely, so it is blocked, not silently passed
through, when it references a labeled physical column. SELECT * and SQL the
parser cannot prove safe are also refused for non-admins. On anonymous or
external egress paths such as public shares and webhook activations, even an
admin identity cannot bypass that refusal.
The raw-SQL check matches physical column names and deliberately fails closed. It can therefore over-block ambiguous SQL rather than risk exposing a labeled value. Admins may query a labeled column directly in non-egress raw SQL; API keys, support users, members, and unknown roles may not.
Related
Section titled “Related”- Governed metrics
- Lifecycle: export, import & restore — promoting and rolling back the assets you’ve certified.
- Data models & relationships — where fields, and row-level security, are defined.
- AI chat — how glossary grounding changes answers.
- Users, roles & invites — who counts as an admin.