Presentations
Annotate a chart
An annotation points at something a chart shows and says it in a number: how far apart two bars are, how much a series grew over a range, what one point is worth or what share of the total it holds. You pick what it points at; Presentations works the number out from the chart’s own values, for each reader, every time the chart is drawn. Nobody types it, so it can’t go stale or disagree with the bars beside it.
What you can add
Section titled “What you can add”| Annotation | What it shows | Shown as |
|---|---|---|
| Difference arrow | The difference between two bars or points: +$0.69M | The difference, or The percent difference of the first |
| Growth arrow | The change over a range, from one category to a later one, with the range named: 2021–2025: +60.0% | The total change, or Compound annual growth (CAGR): CAGR 2021–2025: +12.5% |
| Callout | One point’s value: $1.32M | Its value, or Its share of the total, its whole named: 27.4% of the chart’s total |
A share names what it is a share of. On a stacked chart, a part’s share is of the stack it sits in; on a chart that draws several series side by side, a point’s share is of its own series across the chart (of EMEA’s total); otherwise it is of the chart’s total.
Arrows run in a lane above the chart’s plot (beside it for a horizontal bar chart), with dotted lines down to the bars or points they join and the number in a label on the arrow. Two points of the same category on a line chart are joined by an arrow beside them.
Add one
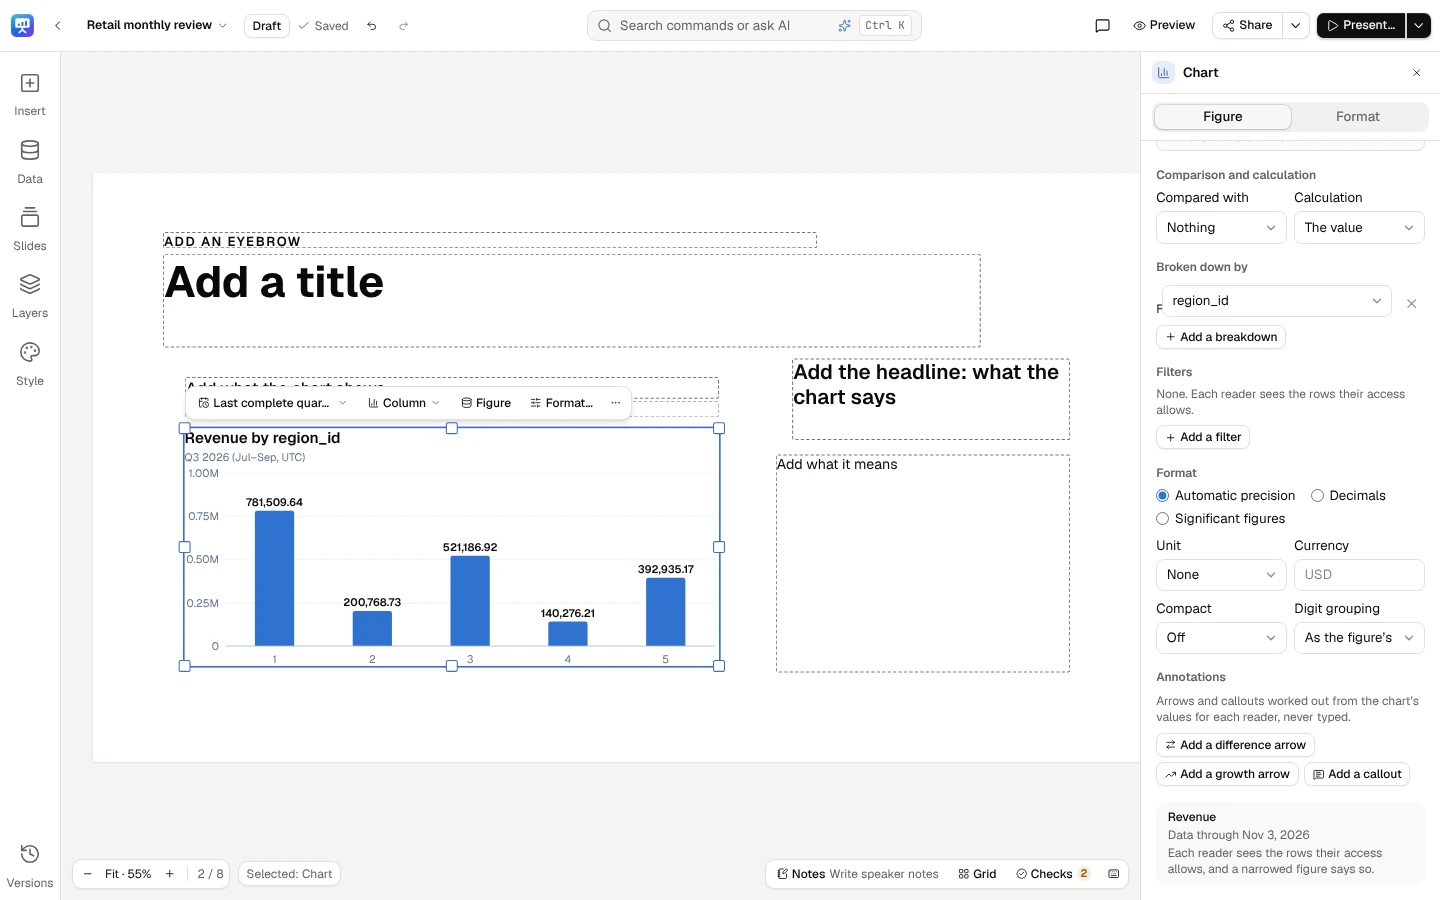
Section titled “Add one”- Select the chart, and open the Figure tab.
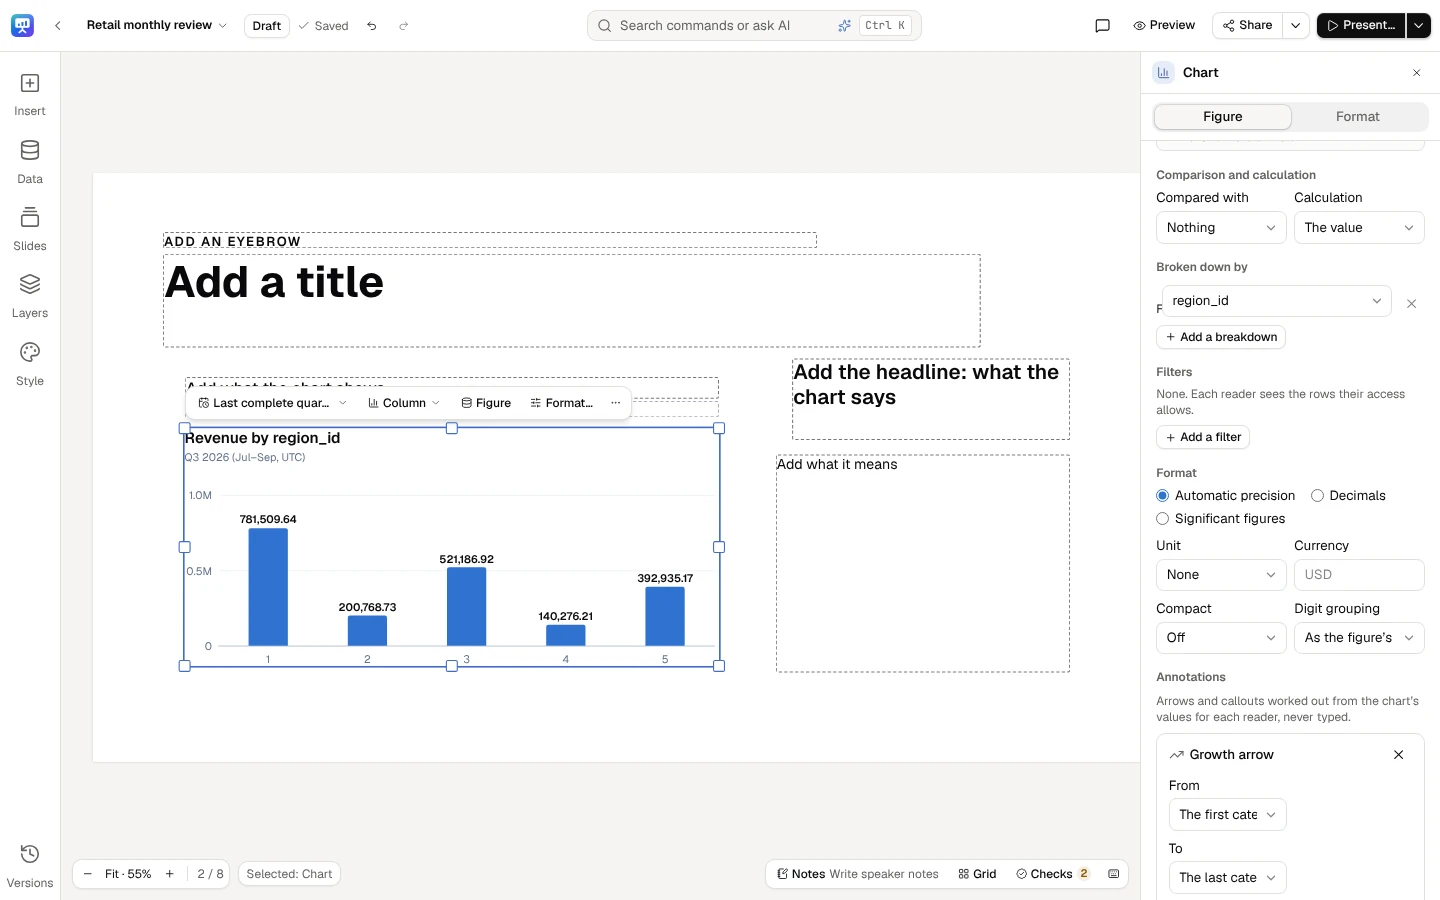
- Under Annotations, select Add a difference arrow, Add a growth arrow or Add a callout.
- Pick its ends: From and To for an arrow, At for a callout, each one of the chart’s categories. Where the chart draws several series, pick the Series of each end; on a stacked chart, All series points at the stack’s total.
- Choose what it is Shown as.
On a chart over time, an end is a period of the chart’s own length: a month on a monthly chart, a quarter on a quarterly one. If you later change the chart from months to quarters, an end picked as a month never moves to the quarter that starts the same day: it shows a dash, July 2026 is a month, and this chart is drawn by quarter: pick the end again., until you pick it again. The first category and The last category follow the chart at any length.
The number it shows is right below, as this chart is served to you, and it changes as you pick. The × beside an annotation removes it. Each change is one step of the slide’s history, so Undo takes it back. A chart holds 8 annotations at most.
A growth arrow can run from The first category to The last category: on a deck whose period rolls forward, such as the last 12 months, it keeps spanning the whole chart as the months move on.
Select a chart and open its Figure tab. Under Annotations, add a difference arrow, a growth arrow or a callout.
A growth arrow shows the change over a range, worked out from the chart’s own values for each reader.
How the number is worked out
Section titled “How the number is worked out”- From the values each reader is served. A reader whose access narrows the chart sees the annotation worked out from their own figures. A frozen deck works it out from its frozen values.
- In the deck’s format. The number is written in the chart’s own format and the deck’s locale, as its labels are: compact units, currency and decimals alike, lakhs and crores in a deck written in en-IN.
- Honestly. A difference between two rates is in points (+3.5 pp). A percent difference from zero or below zero can’t be a percentage, so the arrow shows the difference in units and says why. A compound annual growth rate needs a time axis of months, quarters or years, at least a year between its ends, and values above zero; for a rate it is not given, since rates don’t compound. A share across periods is only given of a measure that adds up over time: of one counted at a date (such as active customers), an average, a ratio, or one counted afresh for each period (such as unique visitors, or a field’s distinct count, minimum or maximum), it is refused with the reason, and the callout can show the value instead.
When it shows a dash
Section titled “When it shows a dash”An annotation never guesses. Where it has no number, it shows —, and the reason is written in the chart’s notes beneath it (and in the Figure tab):
- An end missing from a chart your access narrows: Difference arrow: one end isn’t available with your access. Your access narrows the rows that end needs, whatever its rule is called, and others may see it. As the checks’ note on access does, it never names what is hidden from you: not in the dash, the chart’s notes, its alt text or a PowerPoint file.
- An end with no value in the data, or one a chart nobody’s access narrows doesn’t hold: LATAM isn’t in this chart’s data.
- An end picked at another length of period than the chart now has (see Add one).
- An end on a member a crowded chart now adds into Other (see Broken down by), a member the data itself names “Other” included: Region 25 is grouped into Other on this chart, which draws its 20 largest categories: pick a category it draws.
- An end on Other itself, picked as any bar is, stays on Other: in a period whose chart groups nothing, it shows This chart groups nothing into Other now: pick a category it draws.
- Two ends in different currencies or units, by a breakdown that says so, or a total that would add them up (a stack of USD and EUR): they can’t be compared or added without an exchange rate, so the annotation is refused and asks for values in one currency or unit.
Annotations are drawn on bar, column, stacked column, line, area, stacked area and lollipop charts of values on a linear axis. On any other chart, or one that draws changes, an index or a line on a logarithmic axis, the Figure tab says why and offers none to add. Annotations the chart already holds stay listed there, each with the same reason as the note beneath the chart and its × to remove it.
Where you see it
Section titled “Where you see it”The same annotations, with the same numbers, are on the slide in the editor, in present mode, through links and embedding, on a kiosk, in thumbnails and in a deck opened offline. A PDF or a picture draws them as the slide does. In a PowerPoint file each one is drawn over the chart as shapes and text, its leaders, its arrow and its label, lined up with the chart’s own bars; see Export.
A screen reader hears what each annotation says after the chart’s description (Difference from EMEA to North America: up $0.69M.), after the alt text you wrote for the chart, too. In a PowerPoint file it hears it once, with the chart: the annotation’s own shapes are marked decorative. The Android app draws a chart without its annotations for now; open the deck in a browser to see them.
How the checks read them
Section titled “How the checks read them”The checks read an annotation’s number like any figure bound to data, so it is never flagged as a typed number. A number you type in a text box that matches it is still a typed number, and the checks offer to bind it; a percent difference from a small base is noted on the annotation as on any figure. An annotation belongs to its chart: on a year-to-date chart it is year to date too, so it is never taken for a value beside the chart, and money over more than two years is noted once, for the chart, not again for each arrow. See How the checks work.
Tie a claim to an annotation
Section titled “Tie a claim to an annotation”A sentence on the slide often says what an annotation shows: EMEA grew, North America pulled ahead of EMEA. The annotation’s number isn’t in that sentence, so the checks can’t tell on their own which figure the claim is about. Tie it:
- Edit the text box and select the claim word: grew, fell, ahead of.
- On the text’s quick bar, in More actions, open Claim tied to and choose the annotation. Each is named by its kind and its ends (Difference arrow, North America to EMEA), and by its chart where the slide has more than one.
The tie keeps which annotation the words are about, never its number. The checks then compare each claim word inside the tie with the annotation’s number as each reader is served it, as they compare a claim with a live number beside it: grew beside a difference that is negative is a Must fix finding (W2), with the wording to change. Tied words are still read as you typed them: a number typed among them is still flagged to bind (N1). Where the annotation has no number for a reader (an end its chart no longer draws, data that could not be read), the checks say why. While you edit, tied words have a dashed underline; readers see the words alone. Choose Not tied to untie them.
A tie to a chart a reader may not see is noted for them as any figure their access hides (A1), never as broken. If you delete the annotation, the words stay as you wrote them, still tied to it: the checks flag the claim as bound to a figure the deck no longer has (N4) until you tie it to another annotation or untie it. A duplicated or pasted slide ties its words to its own copy of the chart. Tied words you cut or copy and paste keep their tie on a slide that has that chart, in a text box or the speaker notes; pasted where the slide doesn’t have it, or with a text box copied without its chart, the words come in untied. A story made from the deck keeps the words, untied, since a story’s charts don’t carry annotations.