Exploring dashboards
Everything on this page works with view access only — no edit rights needed. If you build dashboards, see Canvas basics instead.
The dashboard library
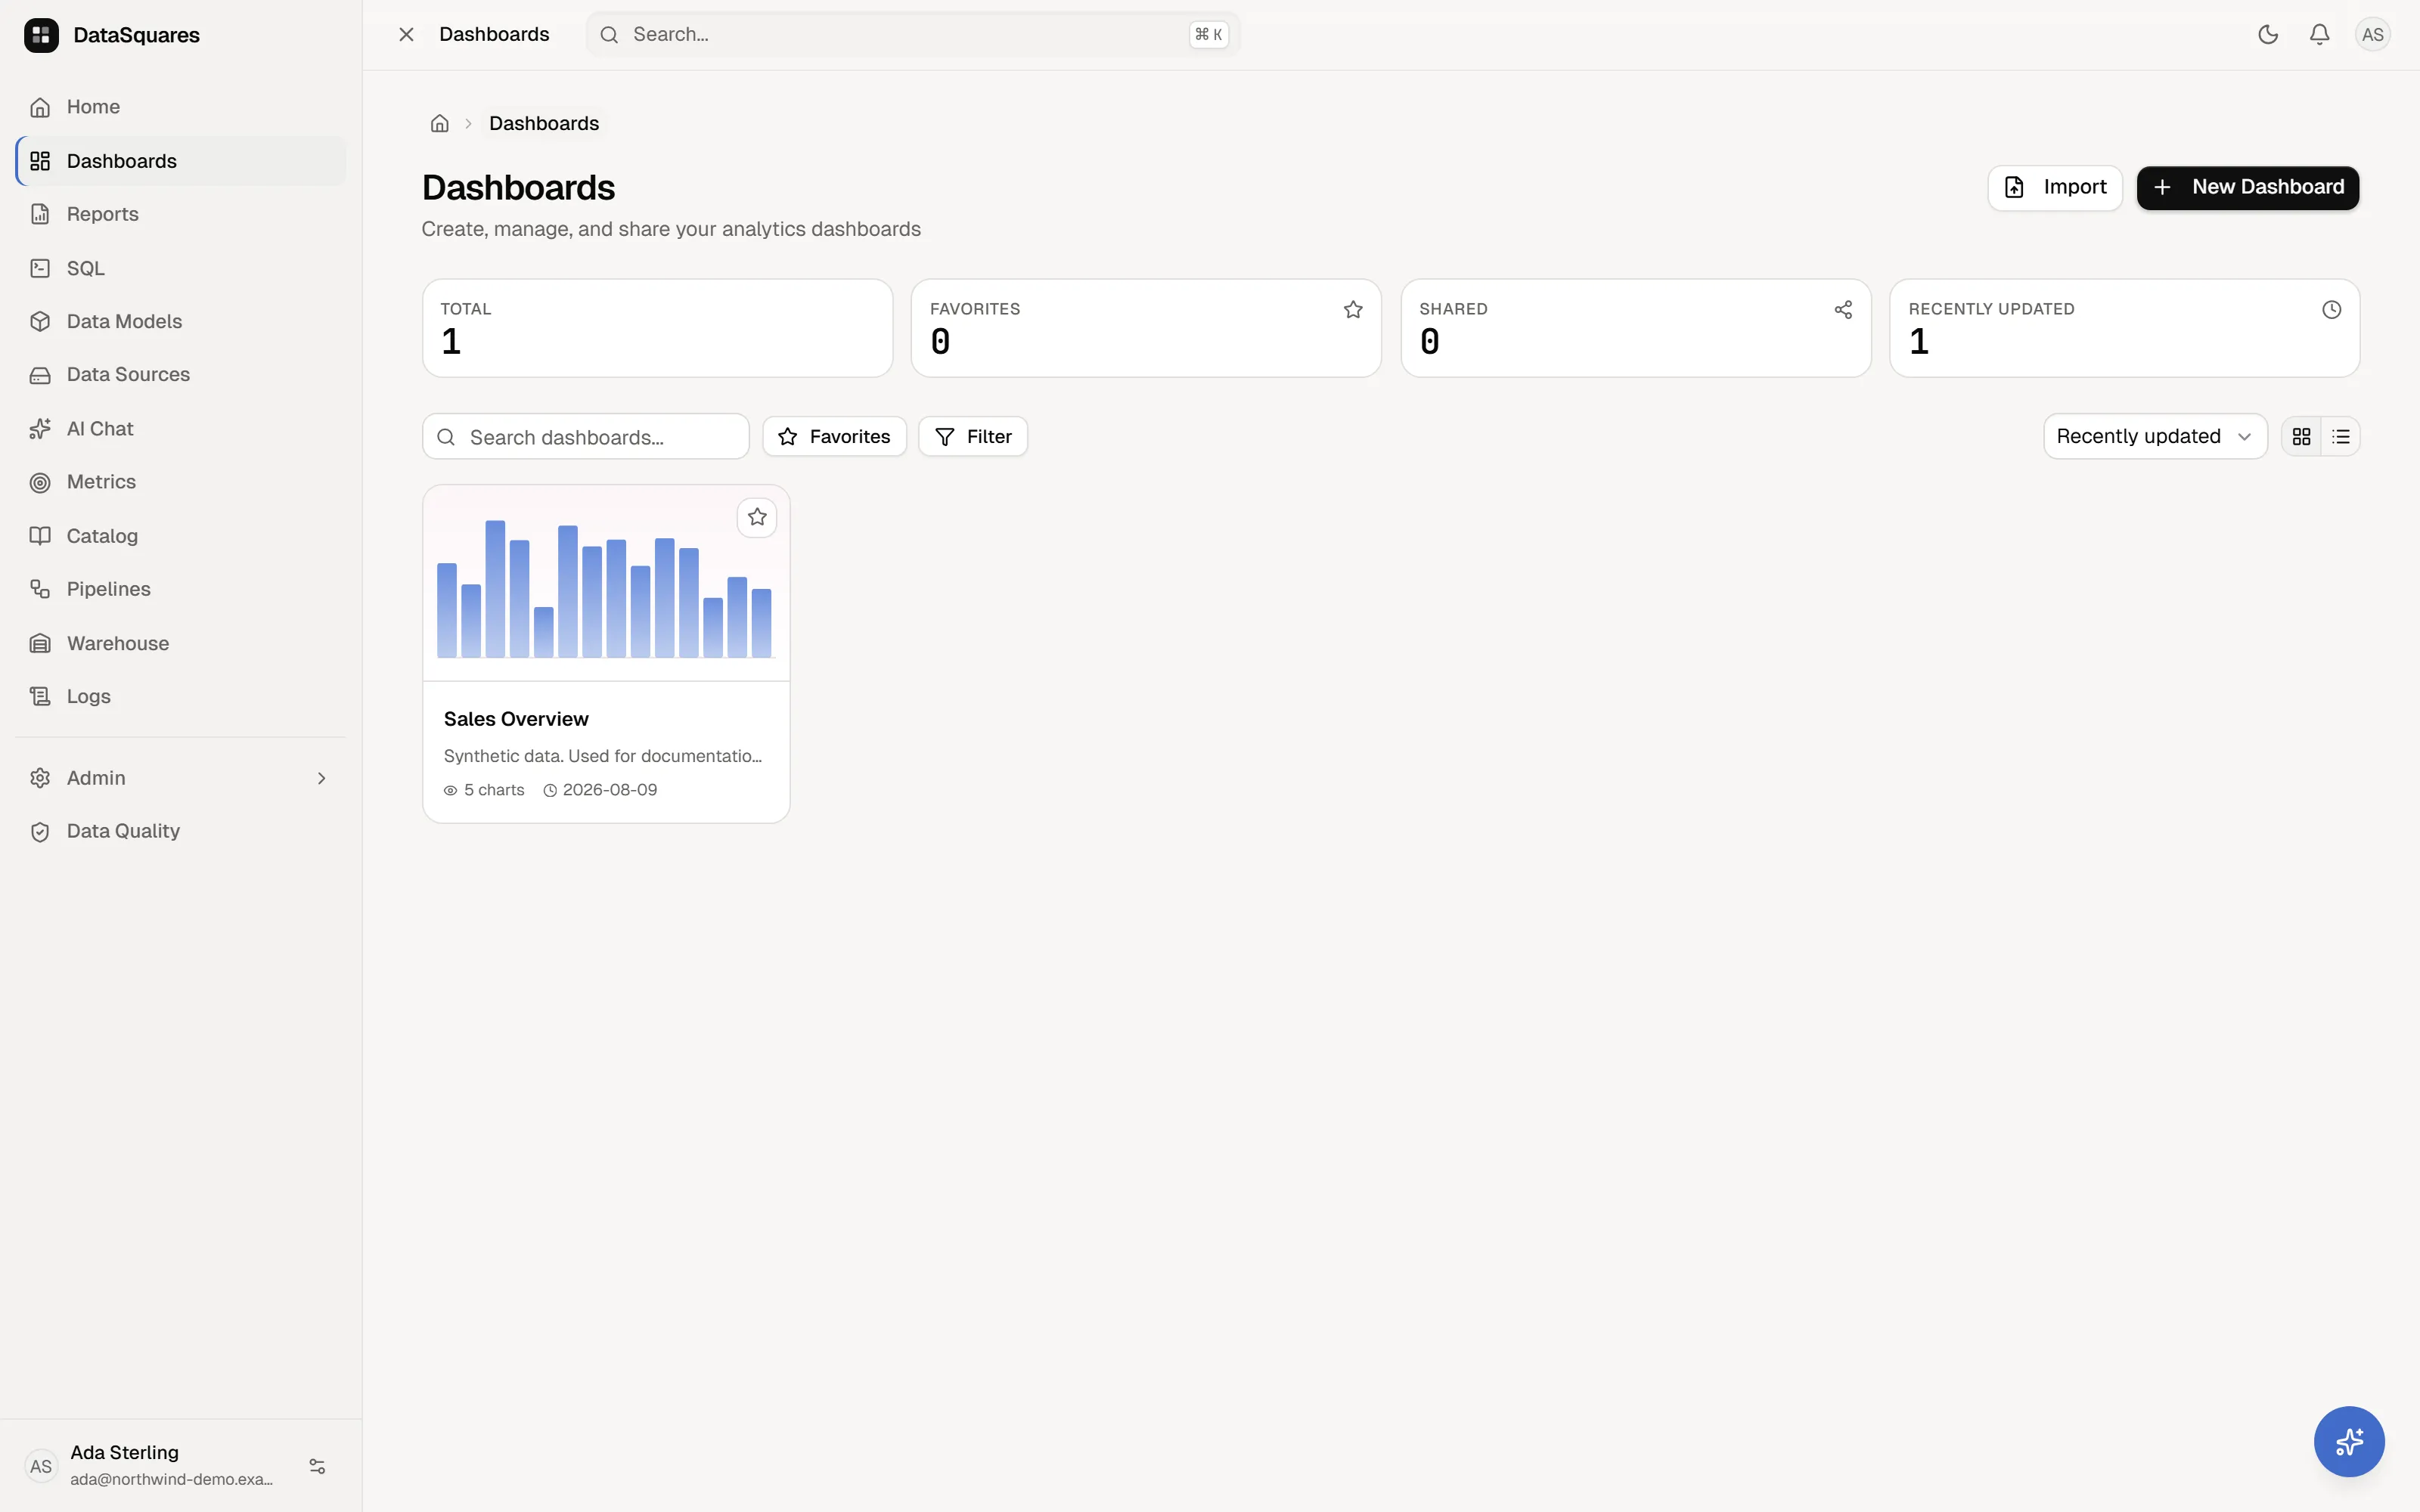
Section titled “The dashboard library”When you open Dashboards, the library gives you quick access to all dashboards accessible to your account:
Scopes and stats
Section titled “Scopes and stats”- Scope toggle — switch between All accessible and Shared with me (dashboards specifically granted to you).
- Live stats strip — view metrics for Total accessible, Favorites loaded, Shared with me, and Updated in the last 7 days.
Searching, filtering, and sorting
Section titled “Searching, filtering, and sorting”- Search — filter dashboards in real-time by title or description.
- Favorites toggle — filter to starred dashboards. Favorites are stored on your account and stay in sync across all your browsers and devices.
- Publication facet — filter by All, Published, or Draft.
- Certification facet — filter by All, Certified, or Standard.
- Updated facet — filter by Any time, Last 7 days, or Last 30 days.
- Sorting — sort by Recently updated, Name (A-Z), or Most cards.
- Grid and List views — switch between visual card thumbnails and a compact tabular list view.
Dashboard actions
Section titled “Dashboard actions”Depending on your permissions, the ••• action menu on each dashboard item
offers:
- Edit dashboard (requires editor permission).
- Duplicate dashboard (creates a personal copy).
- Export definition (downloads the complete dashboard
.jsonschema). - Import definition (available via the Import button in the header to
upload a
.jsonschema). - Delete dashboard (soft delete with confirmation).
Interact with the data
Section titled “Interact with the data”Click a data point to cross-filter the rest of the dashboard, use filter cards and per-card controls, and drill down hierarchies or drill through to detail dashboards. All of it is covered in Filters & interactivity — and all of it carries in the URL, so the back button, bookmarks, and shared links reproduce exactly what you were looking at.
Focus on one card — or present all of them
Section titled “Focus on one card — or present all of them”- Focus mode — expand any card into a full-canvas overlay (with its own
fullscreen toggle) to read a dense table or talk through a single chart.
Escexits. - Spotlight — highlight one card while every other card fades to near
transparency: hover a card and pick the lightbulb. Click anywhere else (or
Esc) to release. Spotlight is part of your view state, so a saved bookmark reopens with it on. - Present — switch the whole dashboard to true browser fullscreen for meetings. Page tabs keep working, so you can step through a multi-page dashboard like a deck.
Personalize a visual
Section titled “Personalize a visual”Hover a chart and choose Personalize (the sliders icon) to explore without edit rights: switch the visual type, swap the dimension, and add or change measures and their aggregation. Changes are yours alone — the dashboard itself is never modified, and everything stays inside your data permissions. Reset a single visual from its panel, or use Reset my visual changes in the bookmark bar to drop them all. Save a bookmark afterwards to keep the personalized view.
Zoom into dense charts
Section titled “Zoom into dense charts”If the author enabled the zoom slider on a chart, drag the slider along its axis (or scroll/pinch inside the plot) to zoom into a dense series and pan across it.
Save your view — and set a default
Section titled “Save your view — and set a default”Arrived at a useful combination of filters, drills, and page? Save it as a bookmark (Saved views). A personal bookmark captures the complete state — filters, cross-filter selections, drill path, spotlight, parameters, personalizations, and the active page — and restores it exactly when you return.
- Personal vs. Shared bookmarks — bookmarks saved by viewers are private to your account. Bookmarks saved by dashboard editors can be shared with everyone who has access.
- Default view — star any of your own bookmarks to make it your default view. It applies automatically every time the dashboard opens, and your personal default wins over the dashboard’s shared default.
- Server persistence — saved views are persisted server-side with conflict-free sibling demotion, ensuring exactly one default per scope.
See the data behind a visual
Section titled “See the data behind a visual”Right-click a data card (or use its menu) and choose Show underlying data to open the row-level table the chart was built from — filtered the same way the chart is, and always scoped to what your row-level security permissions allow.
Export
Section titled “Export”- Per card — Download CSV exports the card’s data (respecting the filters currently applied), and Copy as image puts a PNG of the rendered card on your clipboard, ready to paste into a chat or deck.
- Whole dashboard — the Export menu offers CSV, PNG, PDF (every page), and PowerPoint from the viewer.
Export availability is permission-gated; see Exports for the full matrix.
Stay current
Section titled “Stay current”Dashboards show per-card freshness badges and offer a manual Refresh control (which triggers a fresh cache-burst query); authors can also enable timed auto-refresh intervals. To be notified when a number crosses a threshold — without watching the dashboard — set a metric alert on a KPI card.
Discuss
Section titled “Discuss”Open the Comments pane to start a thread on the dashboard — questions, context, decisions — visible to everyone with access.
- A top-level comment captures your current view (filters, drills, spotlight, parameters, page). Anyone reading it can hit Open this view to see exactly what you saw when you wrote it.
- @mention teammates with the
@button — they get an email with a link that opens the captured view.
Accessibility and contrast
Section titled “Accessibility and contrast”The contrast toggle in the toolbar switches to high-contrast colors (stronger borders and text) and remembers your choice in this browser; the OS-level high-contrast and dark mode preferences are honored automatically too.
Ask AI
Section titled “Ask AI”Viewers can use AI chat too: ask questions about the data in natural language and get charted answers, scoped to your permissions.
- Per-card AI summaries — view concise author-generated summaries right above visual cards.
- Card insights — open a card’s menu to run Explain this change and Analyze for period-over-period breakdowns, anomalies, key influencers, and forecasts, all with view access only.