Mobile app - dashboards
Dashboards open in the app’s viewer, drawn for your account. The action bar at the bottom offers Filters, Pages, Views, Share and More; an item is greyed out when the dashboard has nothing for it (no filters, one page). For how filters and drilling behave, see Filters & interactivity and Exploring dashboards.
Open a dashboard
Section titled “Open a dashboard”Choose a dashboard in the Library. The star favourites it; the three dots open more options.
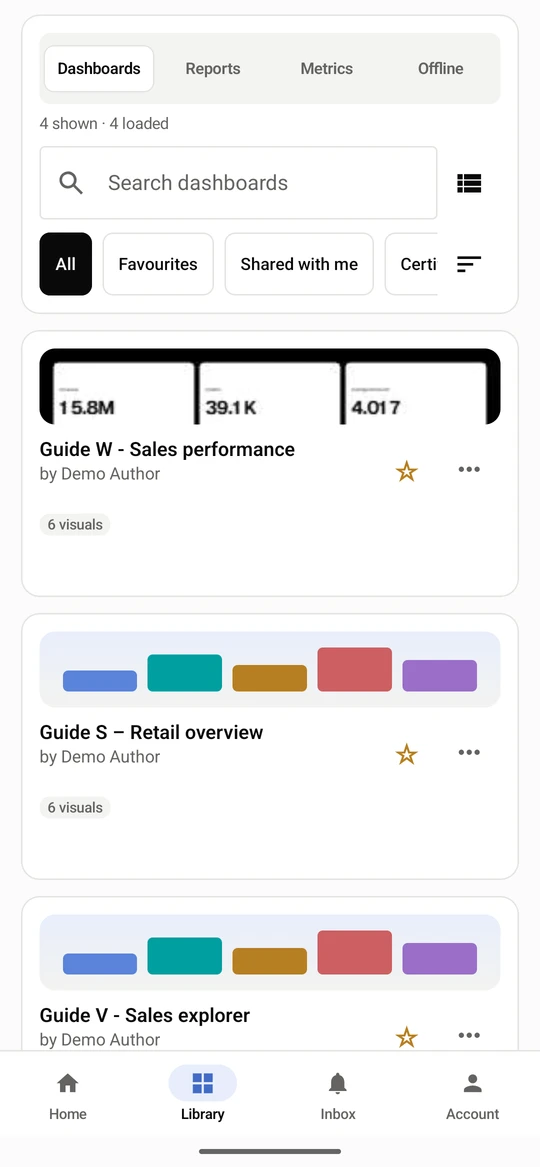
The dashboard opens with its cards drawn for your account. Close dashboard (the arrow) returns to the Library; the star favourites it.
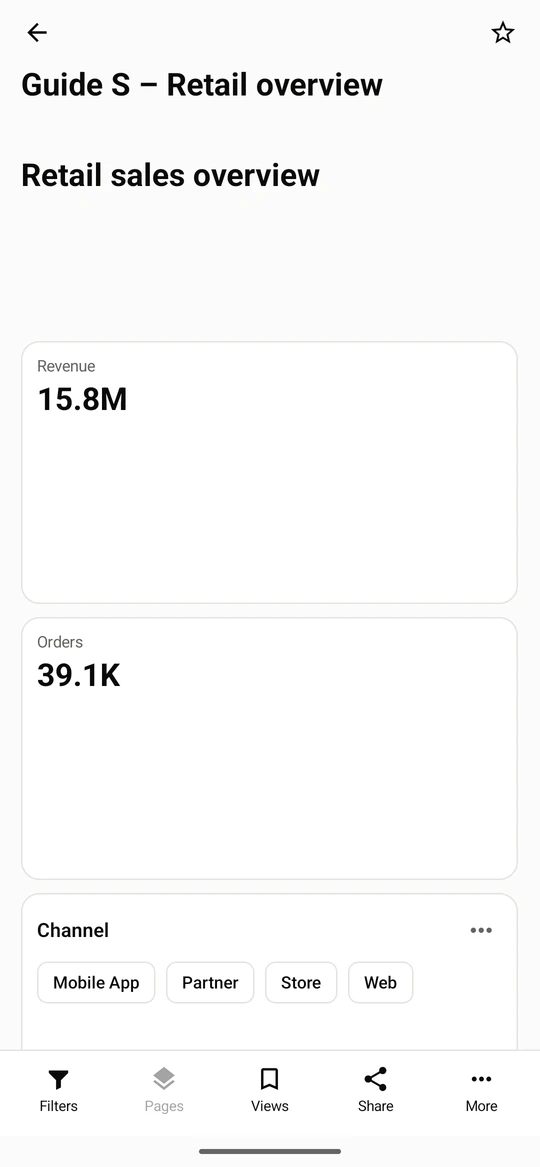
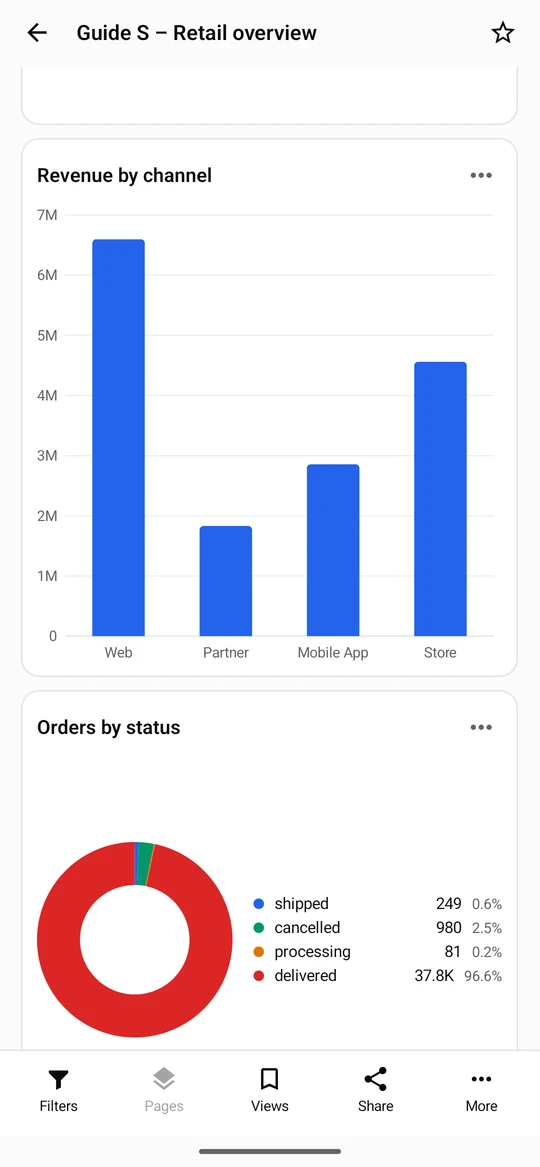
Scroll to read further cards. The action bar at the bottom stays in reach: Filters, Pages, Views, Share and More.
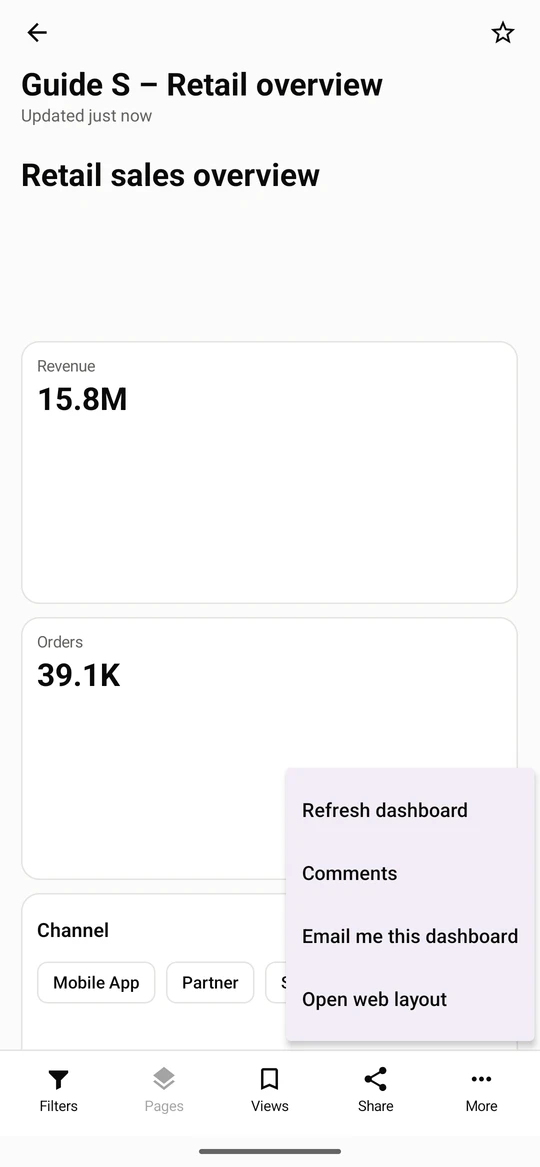
More offers Refresh dashboard, Comments, Email me this dashboard and Open web layout.
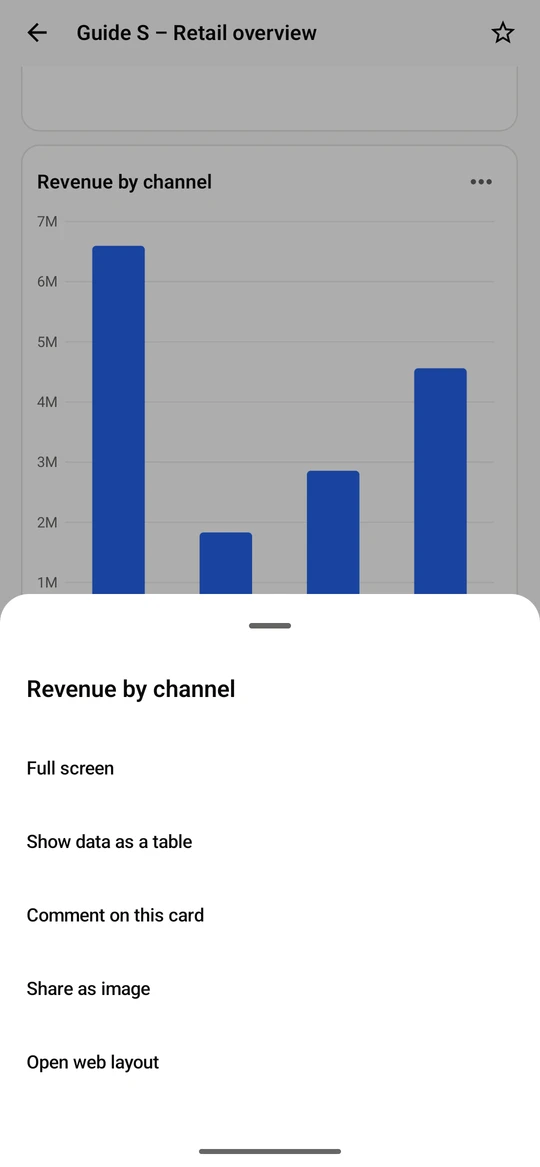
Every card has an actions button. Full screen opens the card alone, Show data as a table lists what it plots, Comment on this card starts a comment and Open web layout shows the dashboard as it looks on the web.
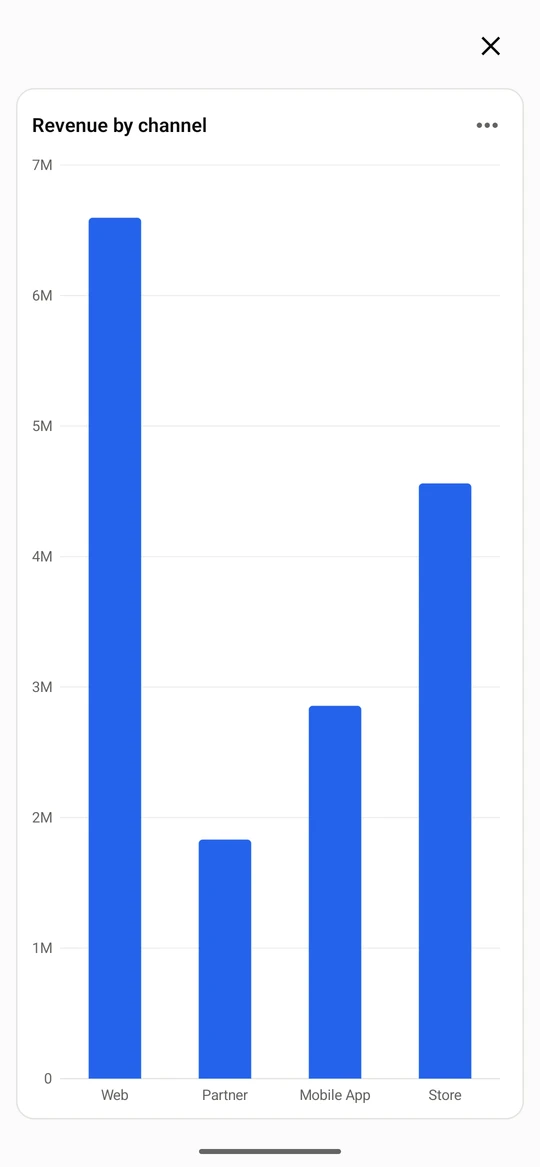
In Full screen the card fills the phone. Close it with the cross at the top right.
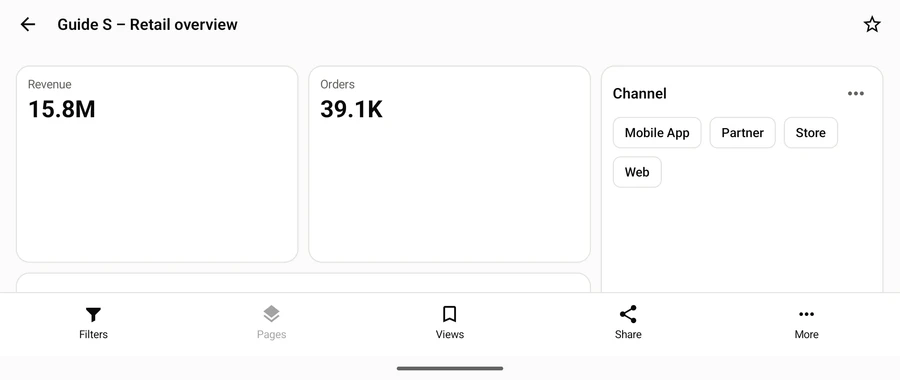
Turn the phone sideways and the dashboard reflows to use the wider screen.
When a dashboard has more than one page, Pages lists them. The check shows the page you are on.
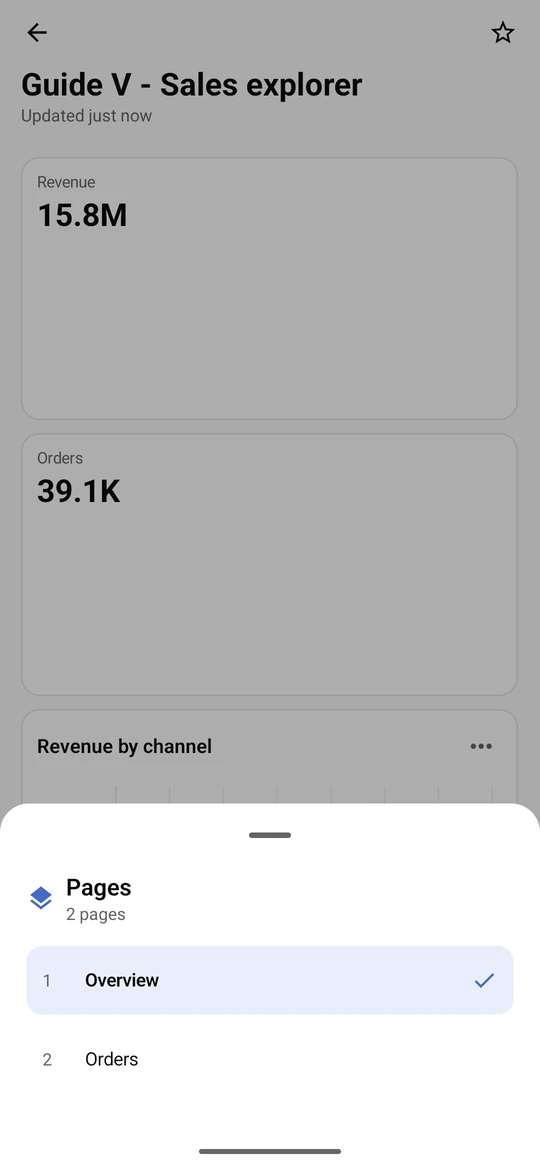
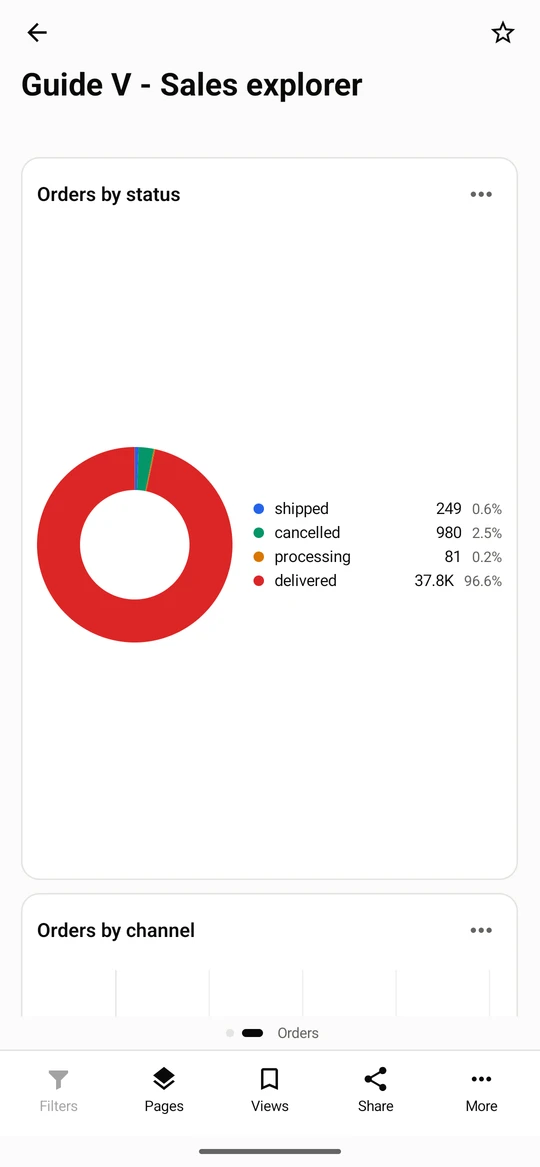
Choose a page and it opens. The dots and the name at the bottom show which page you are on.
Filter a dashboard
Section titled “Filter a dashboard”A dashboard with a slicer shows its choices in a card. Filters in the action bar is available.
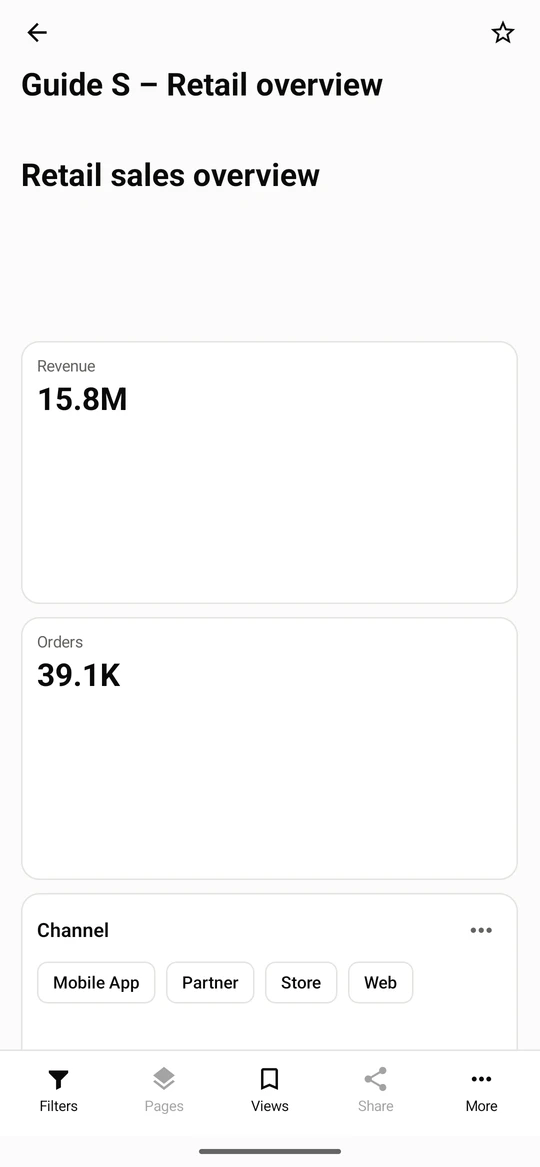
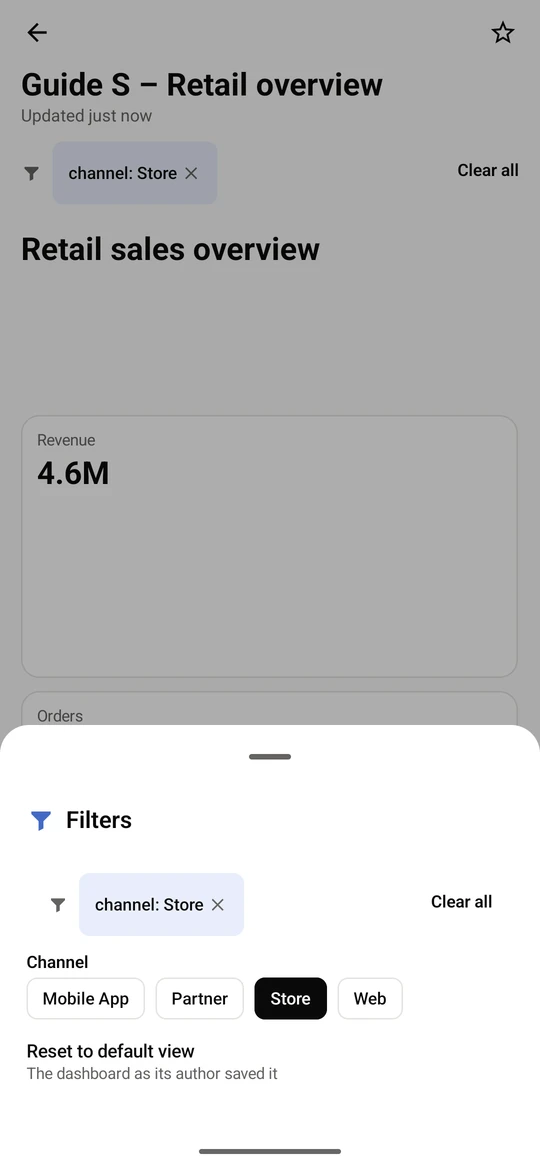
Filters opens a sheet with one row per filter. Pick a value, for example Store under Channel.
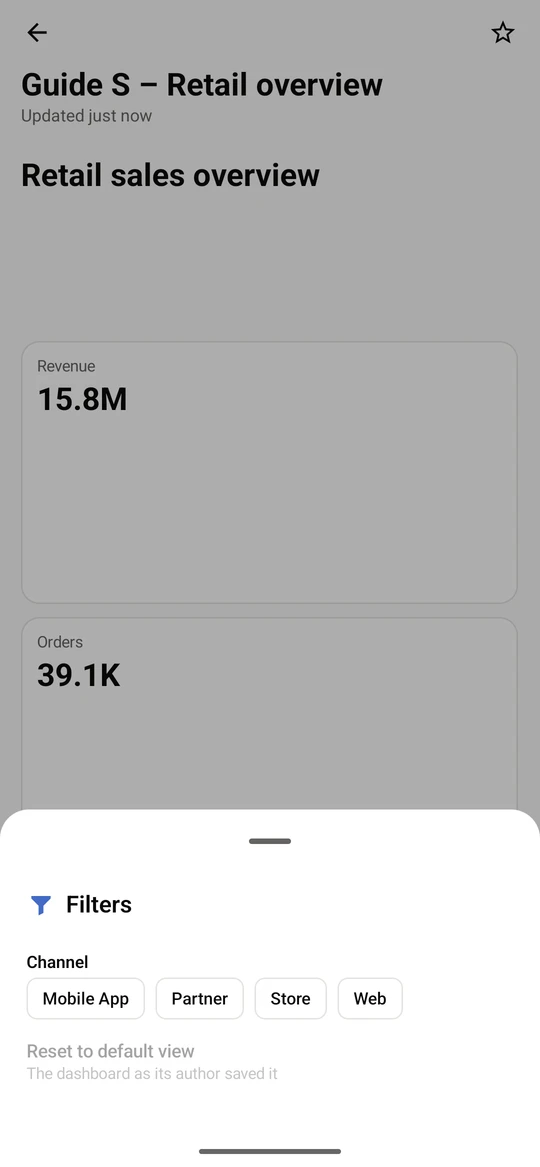
The sheet lists what you filtered by, with Clear all. Reset to default view returns to the dashboard as its author saved it.
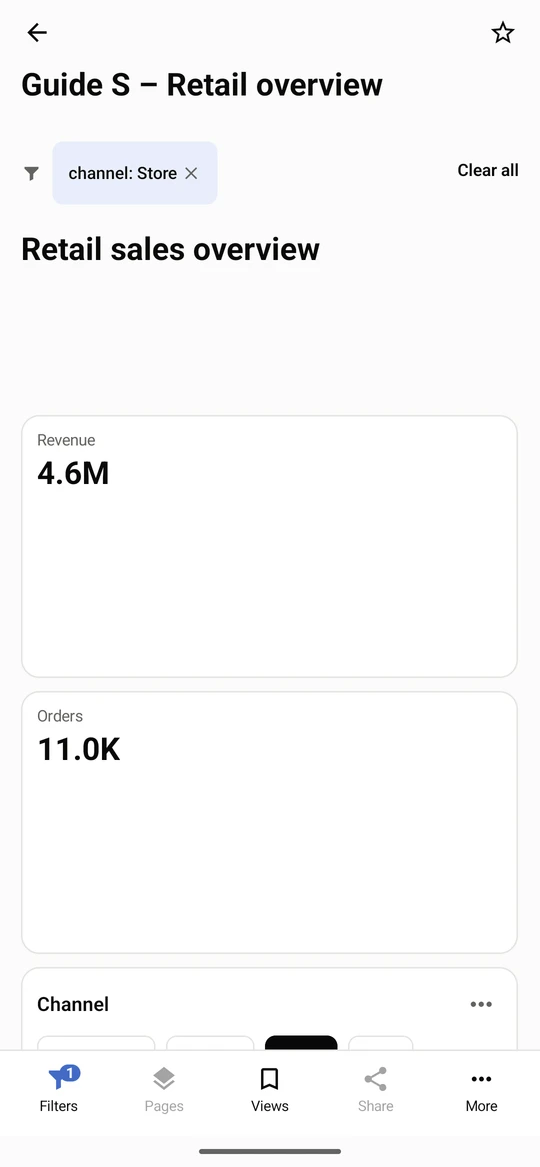
The cards recalculate for Store and a Filtered by line stays above them. Clear all removes the filter.
Scan a QR code
Section titled “Scan a QR code”A DataSquares QR code opens its dashboard directly. The camera is asked for only when you open the scanner.
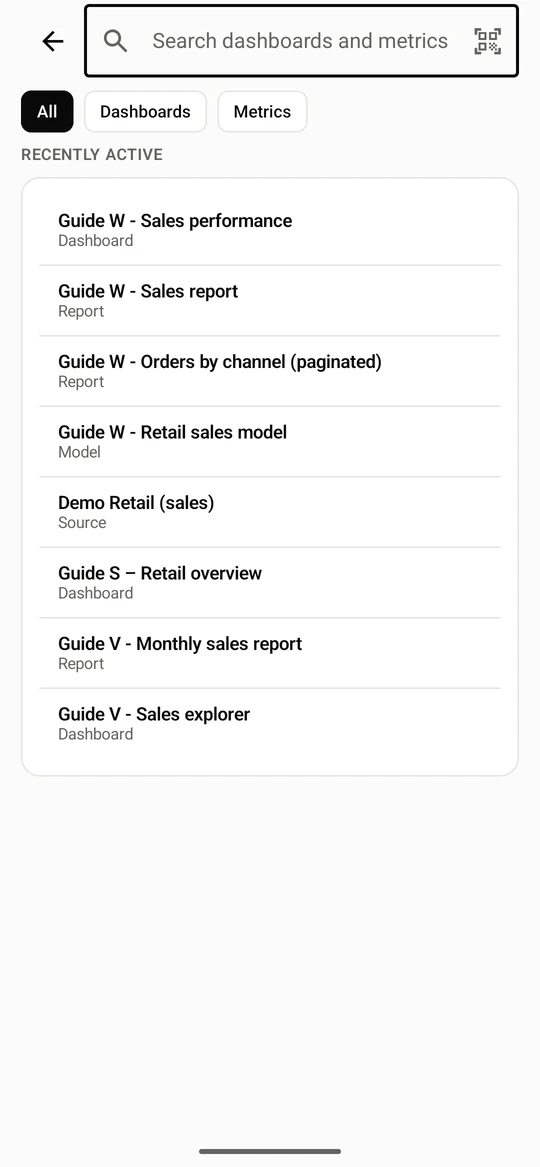
Open search. The Scan a QR code button sits at the right of the search box.
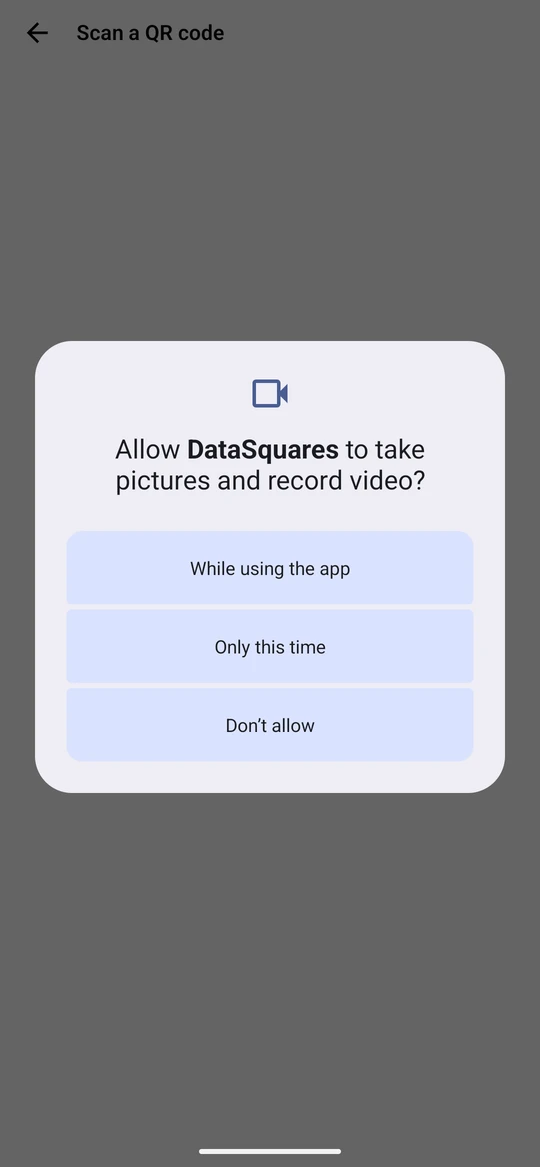
The first time, Android asks to allow the camera. Choose While using the app or Only this time.
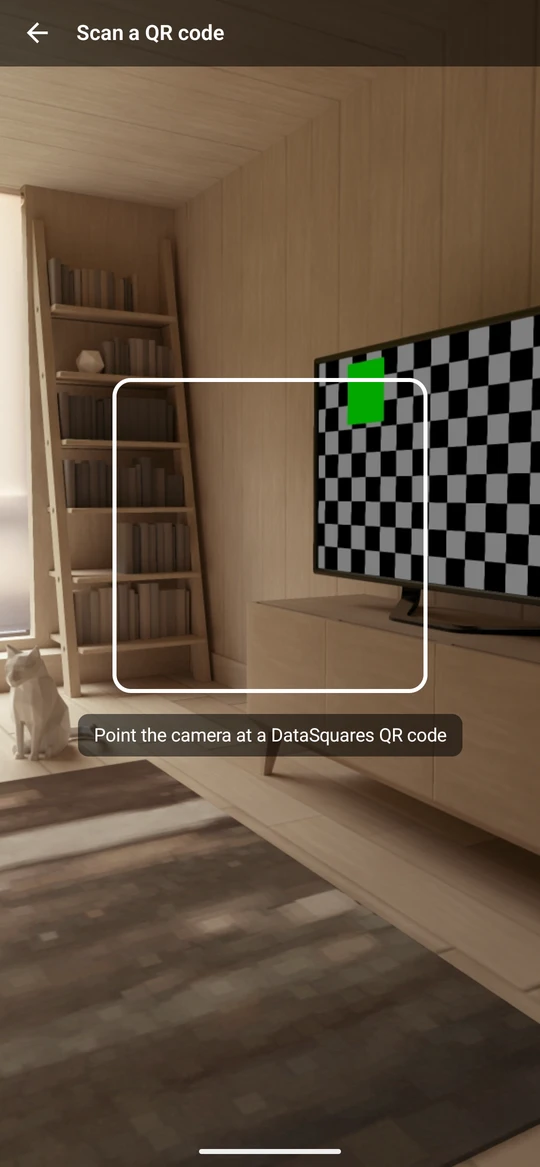
Point the camera at a DataSquares QR code; the dashboard opens. (The emulator shows its virtual scene, so nothing is scanned here.)
Keep a dashboard offline
Section titled “Keep a dashboard offline”A copy kept on the phone opens without a connection. Your organization can turn this off (see Settings & operations).
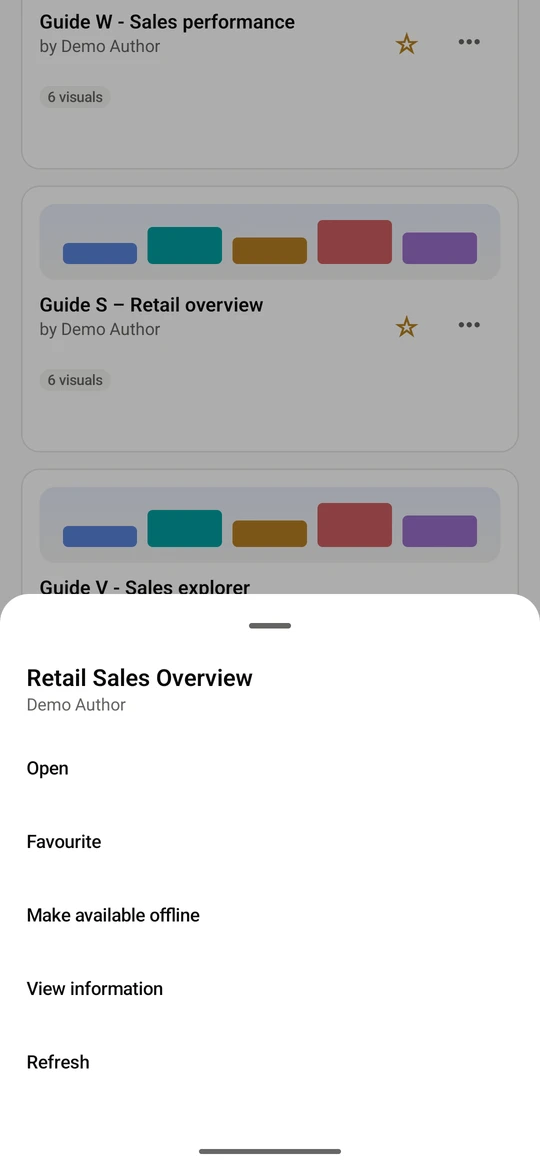
Open a dashboard's More options menu in the Library and choose Make available offline.
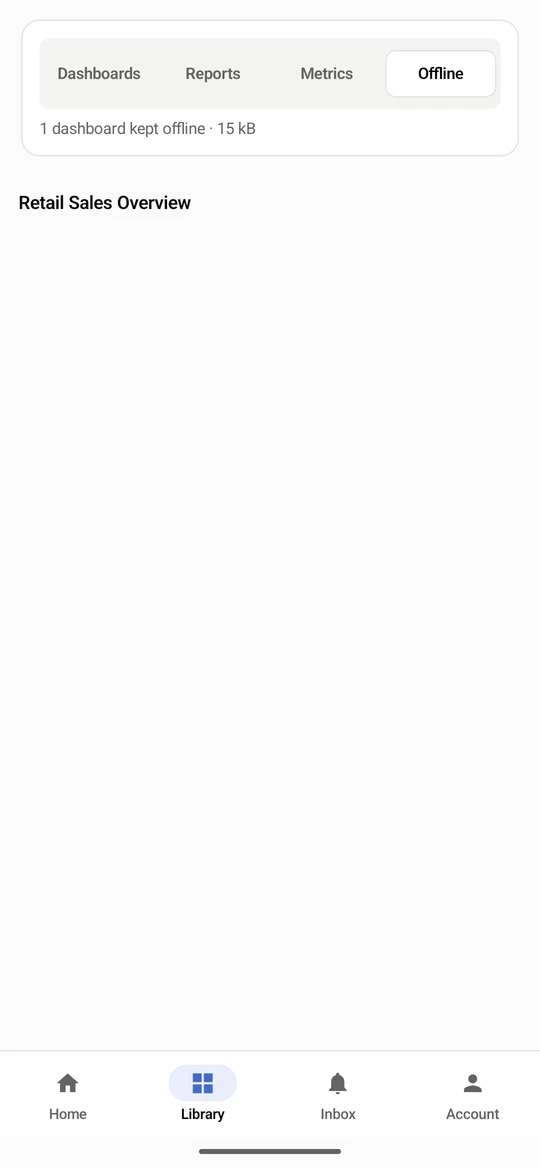
The Offline segment lists the copies kept on this phone, with how big they are and when they were saved.
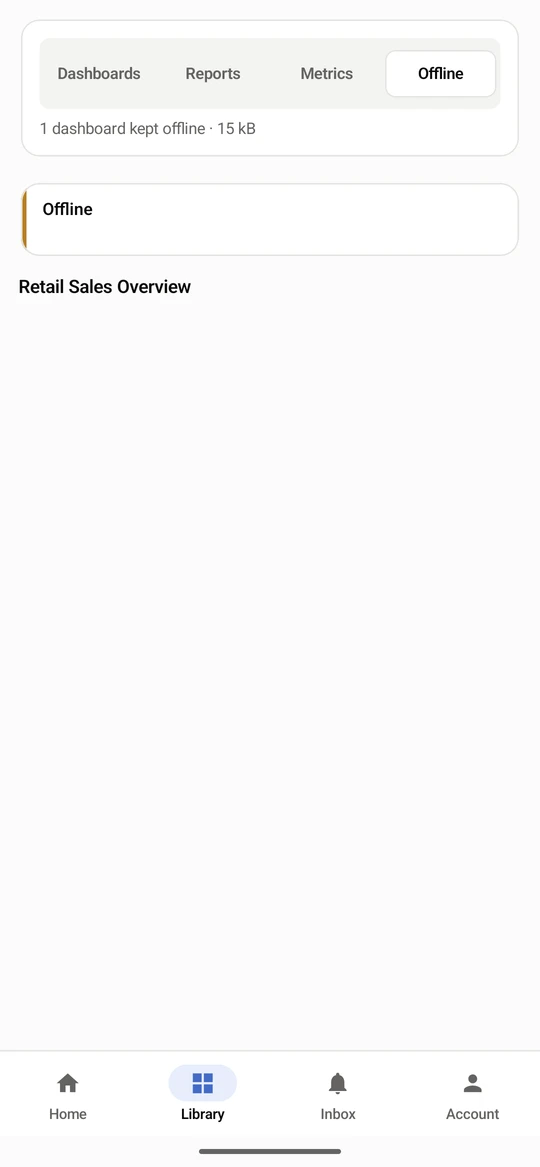
With no connection the Library says Offline and still lists your copies.
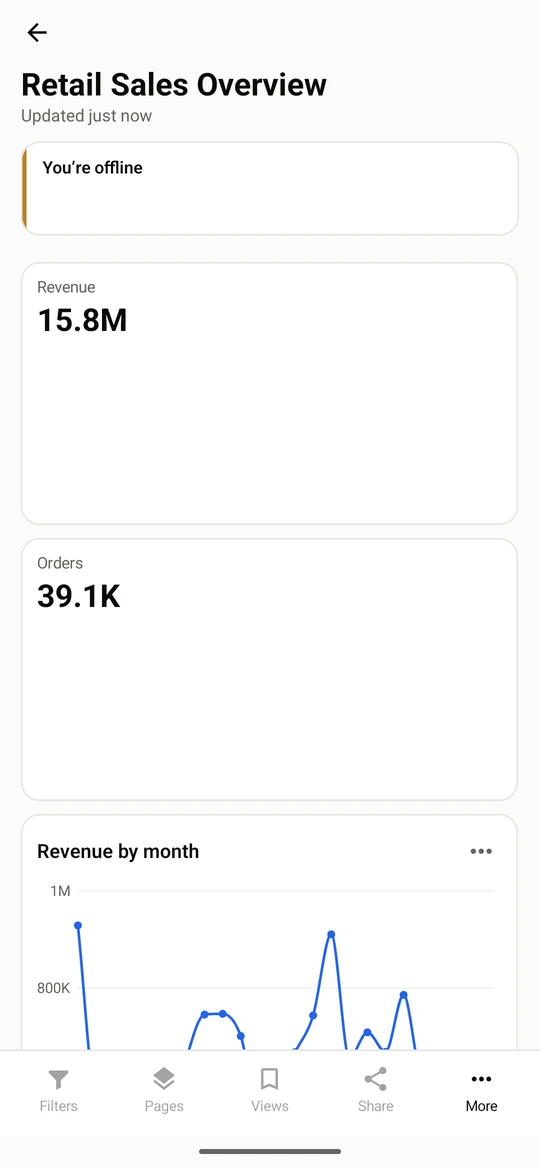
Open the copy without a connection. The dashboard still opens and a banner says Offline; refresh it when you are back online.
Share a dashboard
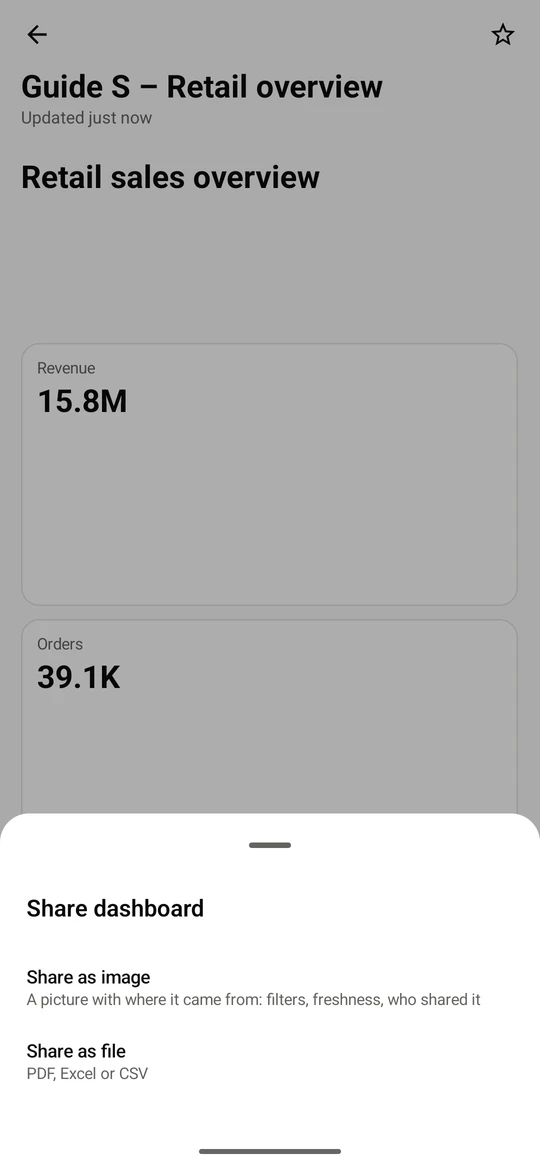
Section titled “Share a dashboard”Share in the action bar offers Share as image and Share as file. Which of these you see follows what your role may share and export. A file is a PDF document, an Excel workbook or a CSV of the view you are looking at, with its filters, and respects your data permissions. The phone’s own share sheet then sends it.
Share in the action bar opens the share sheet: Share as image or Share as file. What you see depends on what your role may share and export.
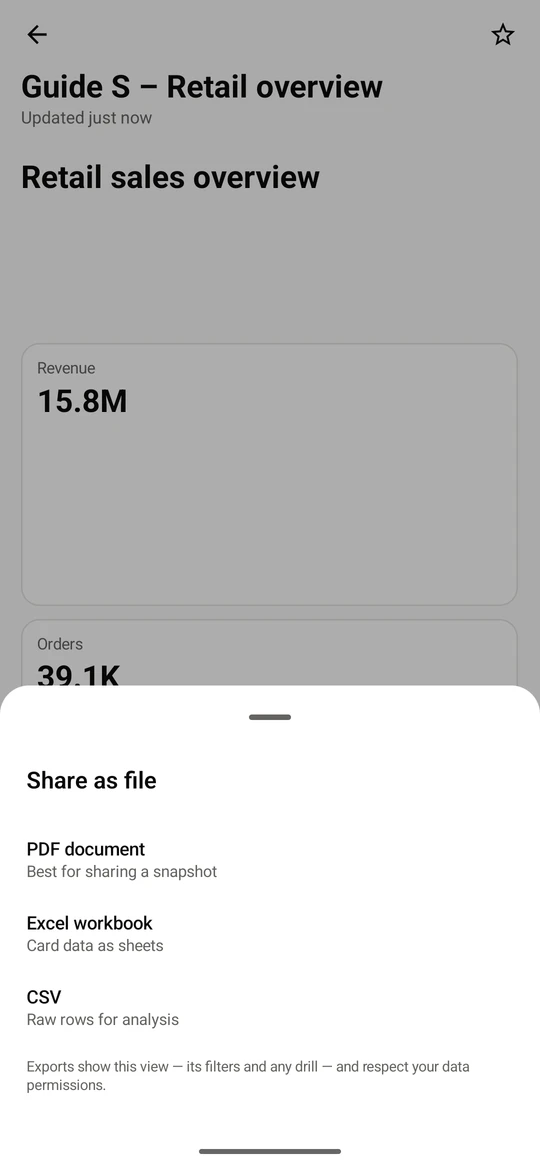
Share as file offers a PDF document, an Excel workbook and a CSV. Exports show the view you are looking at, with its filters, and respect your data permissions.
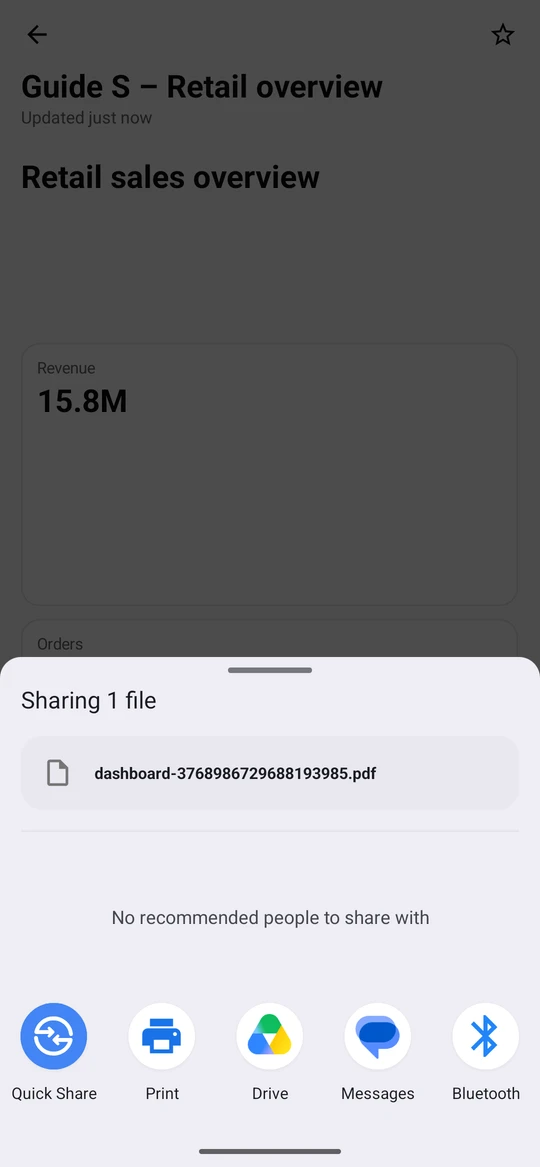
The file is made on the server, then the phone's own share sheet opens so you can send the PDF with any app.
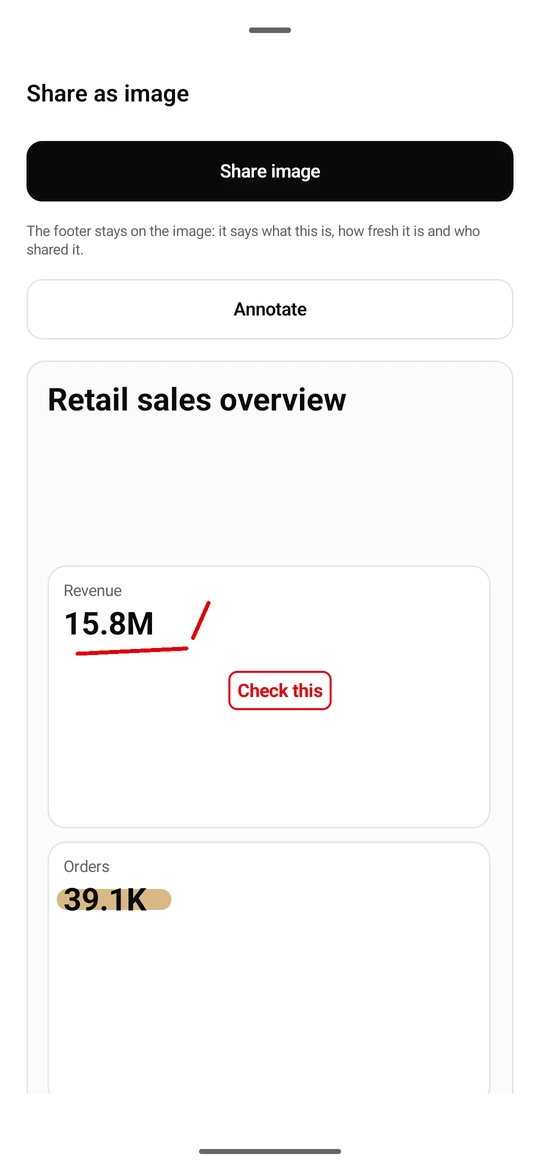
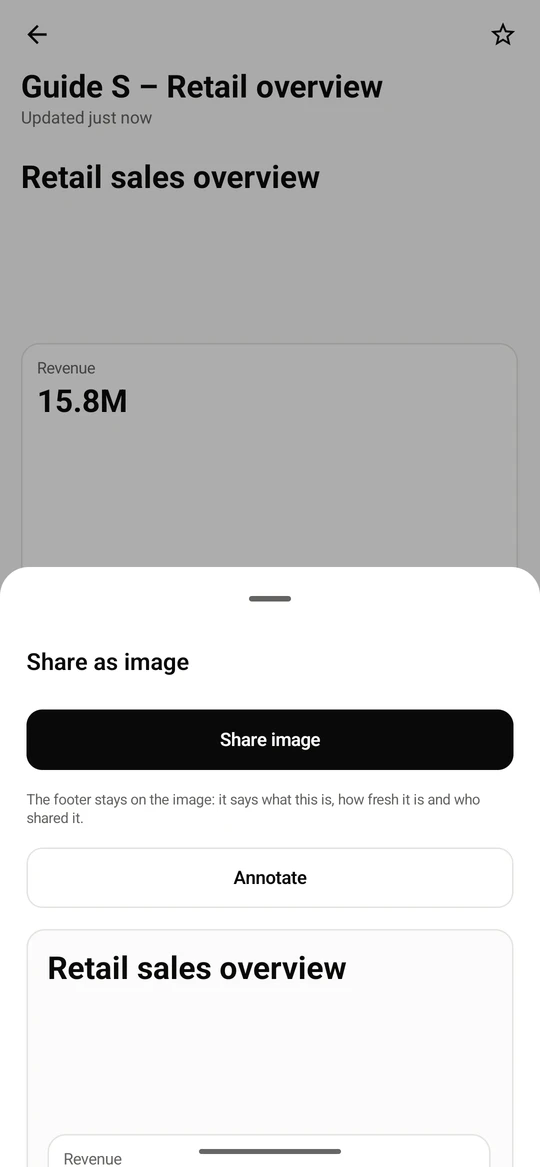
Share as image sends a picture of the dashboard. The footer on the image says what it is, how fresh the data is and who shared it.
Mark up a picture before you share it
Section titled “Mark up a picture before you share it”In Share as image, Annotate opens a Pen, a Highlighter and Text with Undo. Marks go on the cards only, never on the footer that says what the picture is, how fresh it is and who shared it.
Share as image shows the picture exactly as it will be sent, with Annotate under the Share image button.
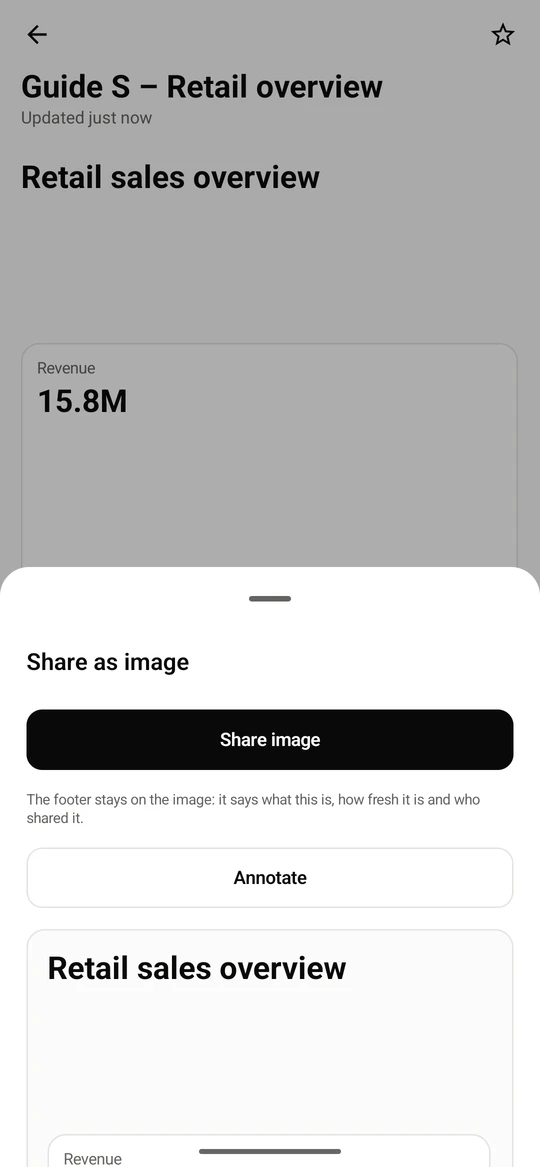
Annotate opens three tools: Pen, Highlighter and Text. The footer of the picture is never drawn on.
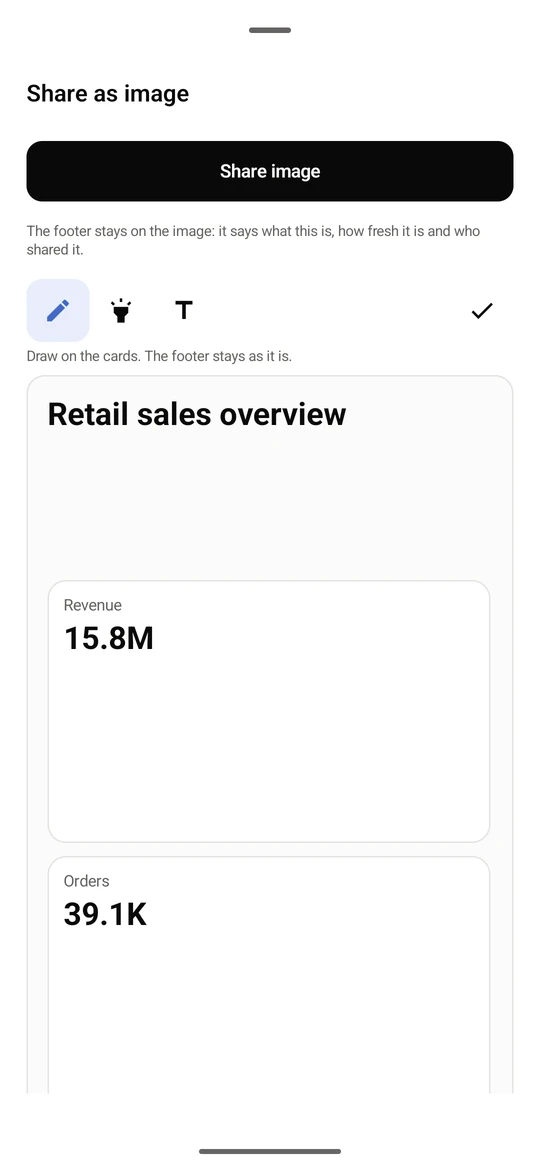
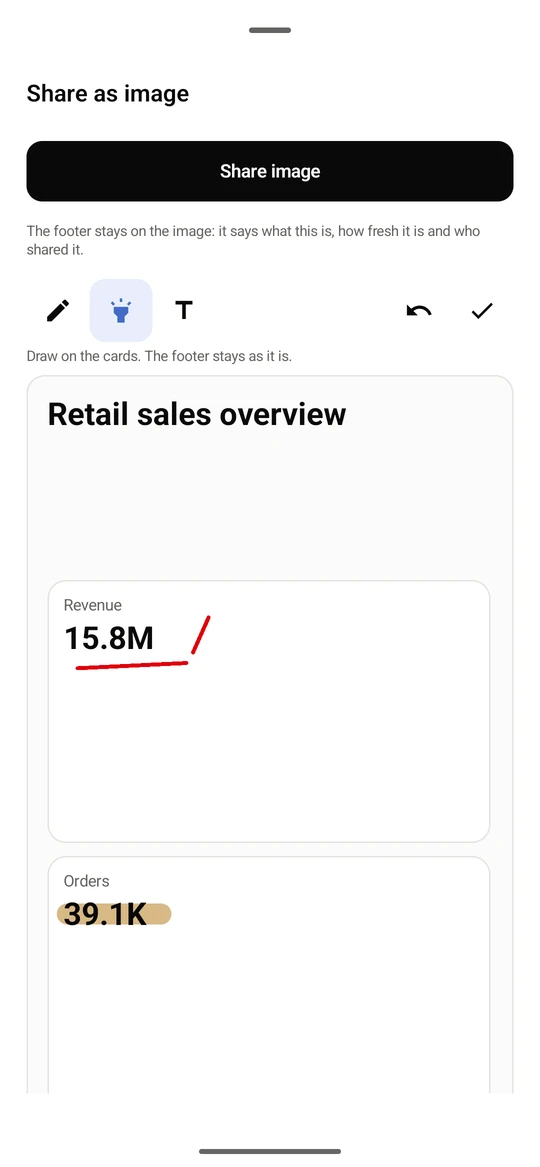
Draw with the Pen to circle a number or underline a trend.
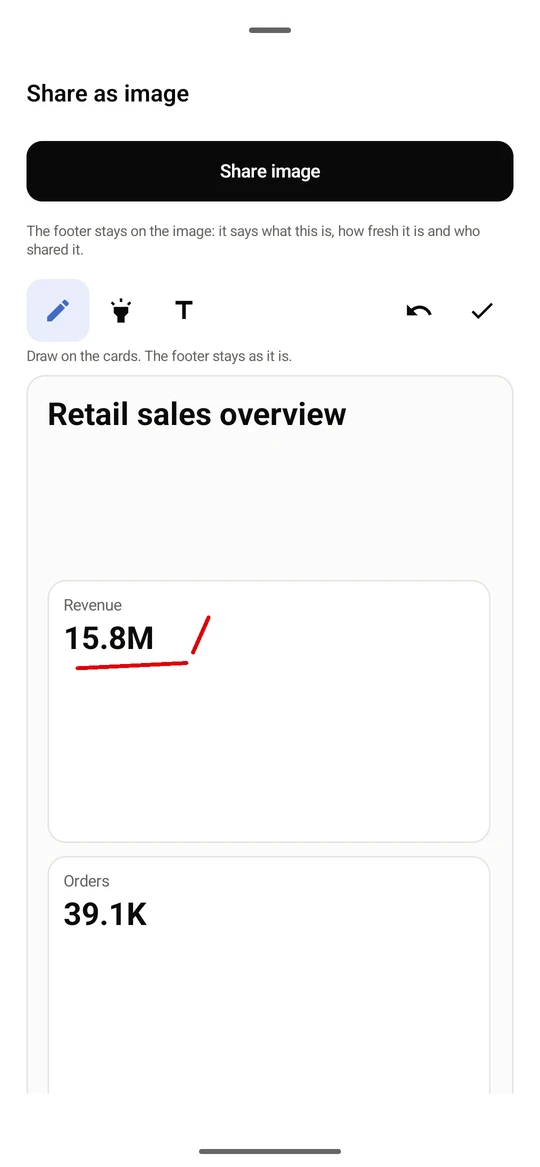
The Highlighter marks words without hiding them. Undo removes the last mark.
Choose Text, type a Note, then tap where it goes on the picture.
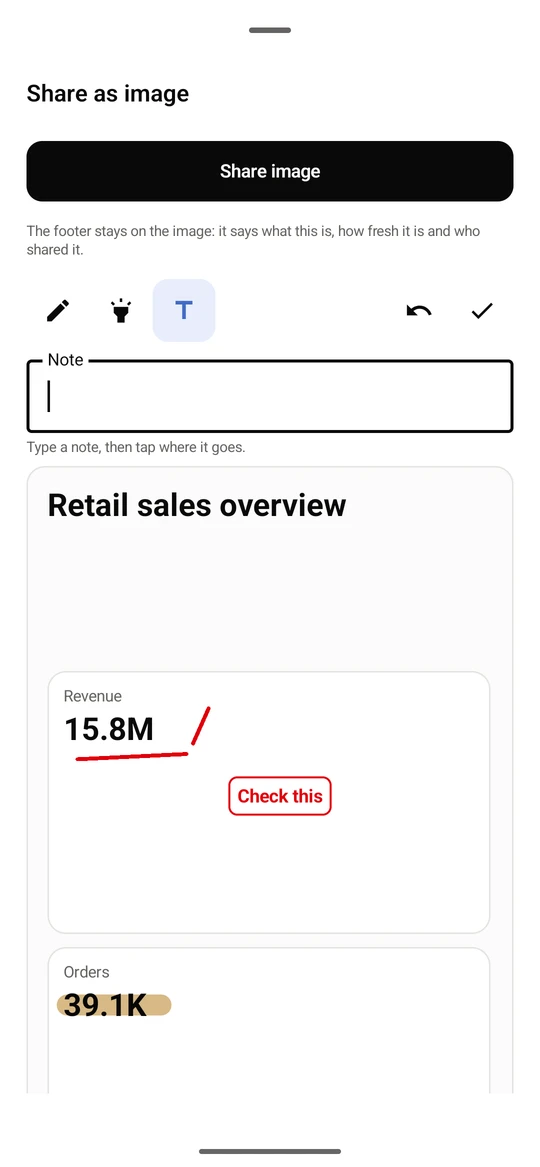
Select Done annotating. Share image now sends the picture with your marks.