What is DataSquares?
DataSquares is a business intelligence platform: you connect it to the places your data already lives, shape that data into models, and build dashboards and reports your whole team can view, filter, and export.
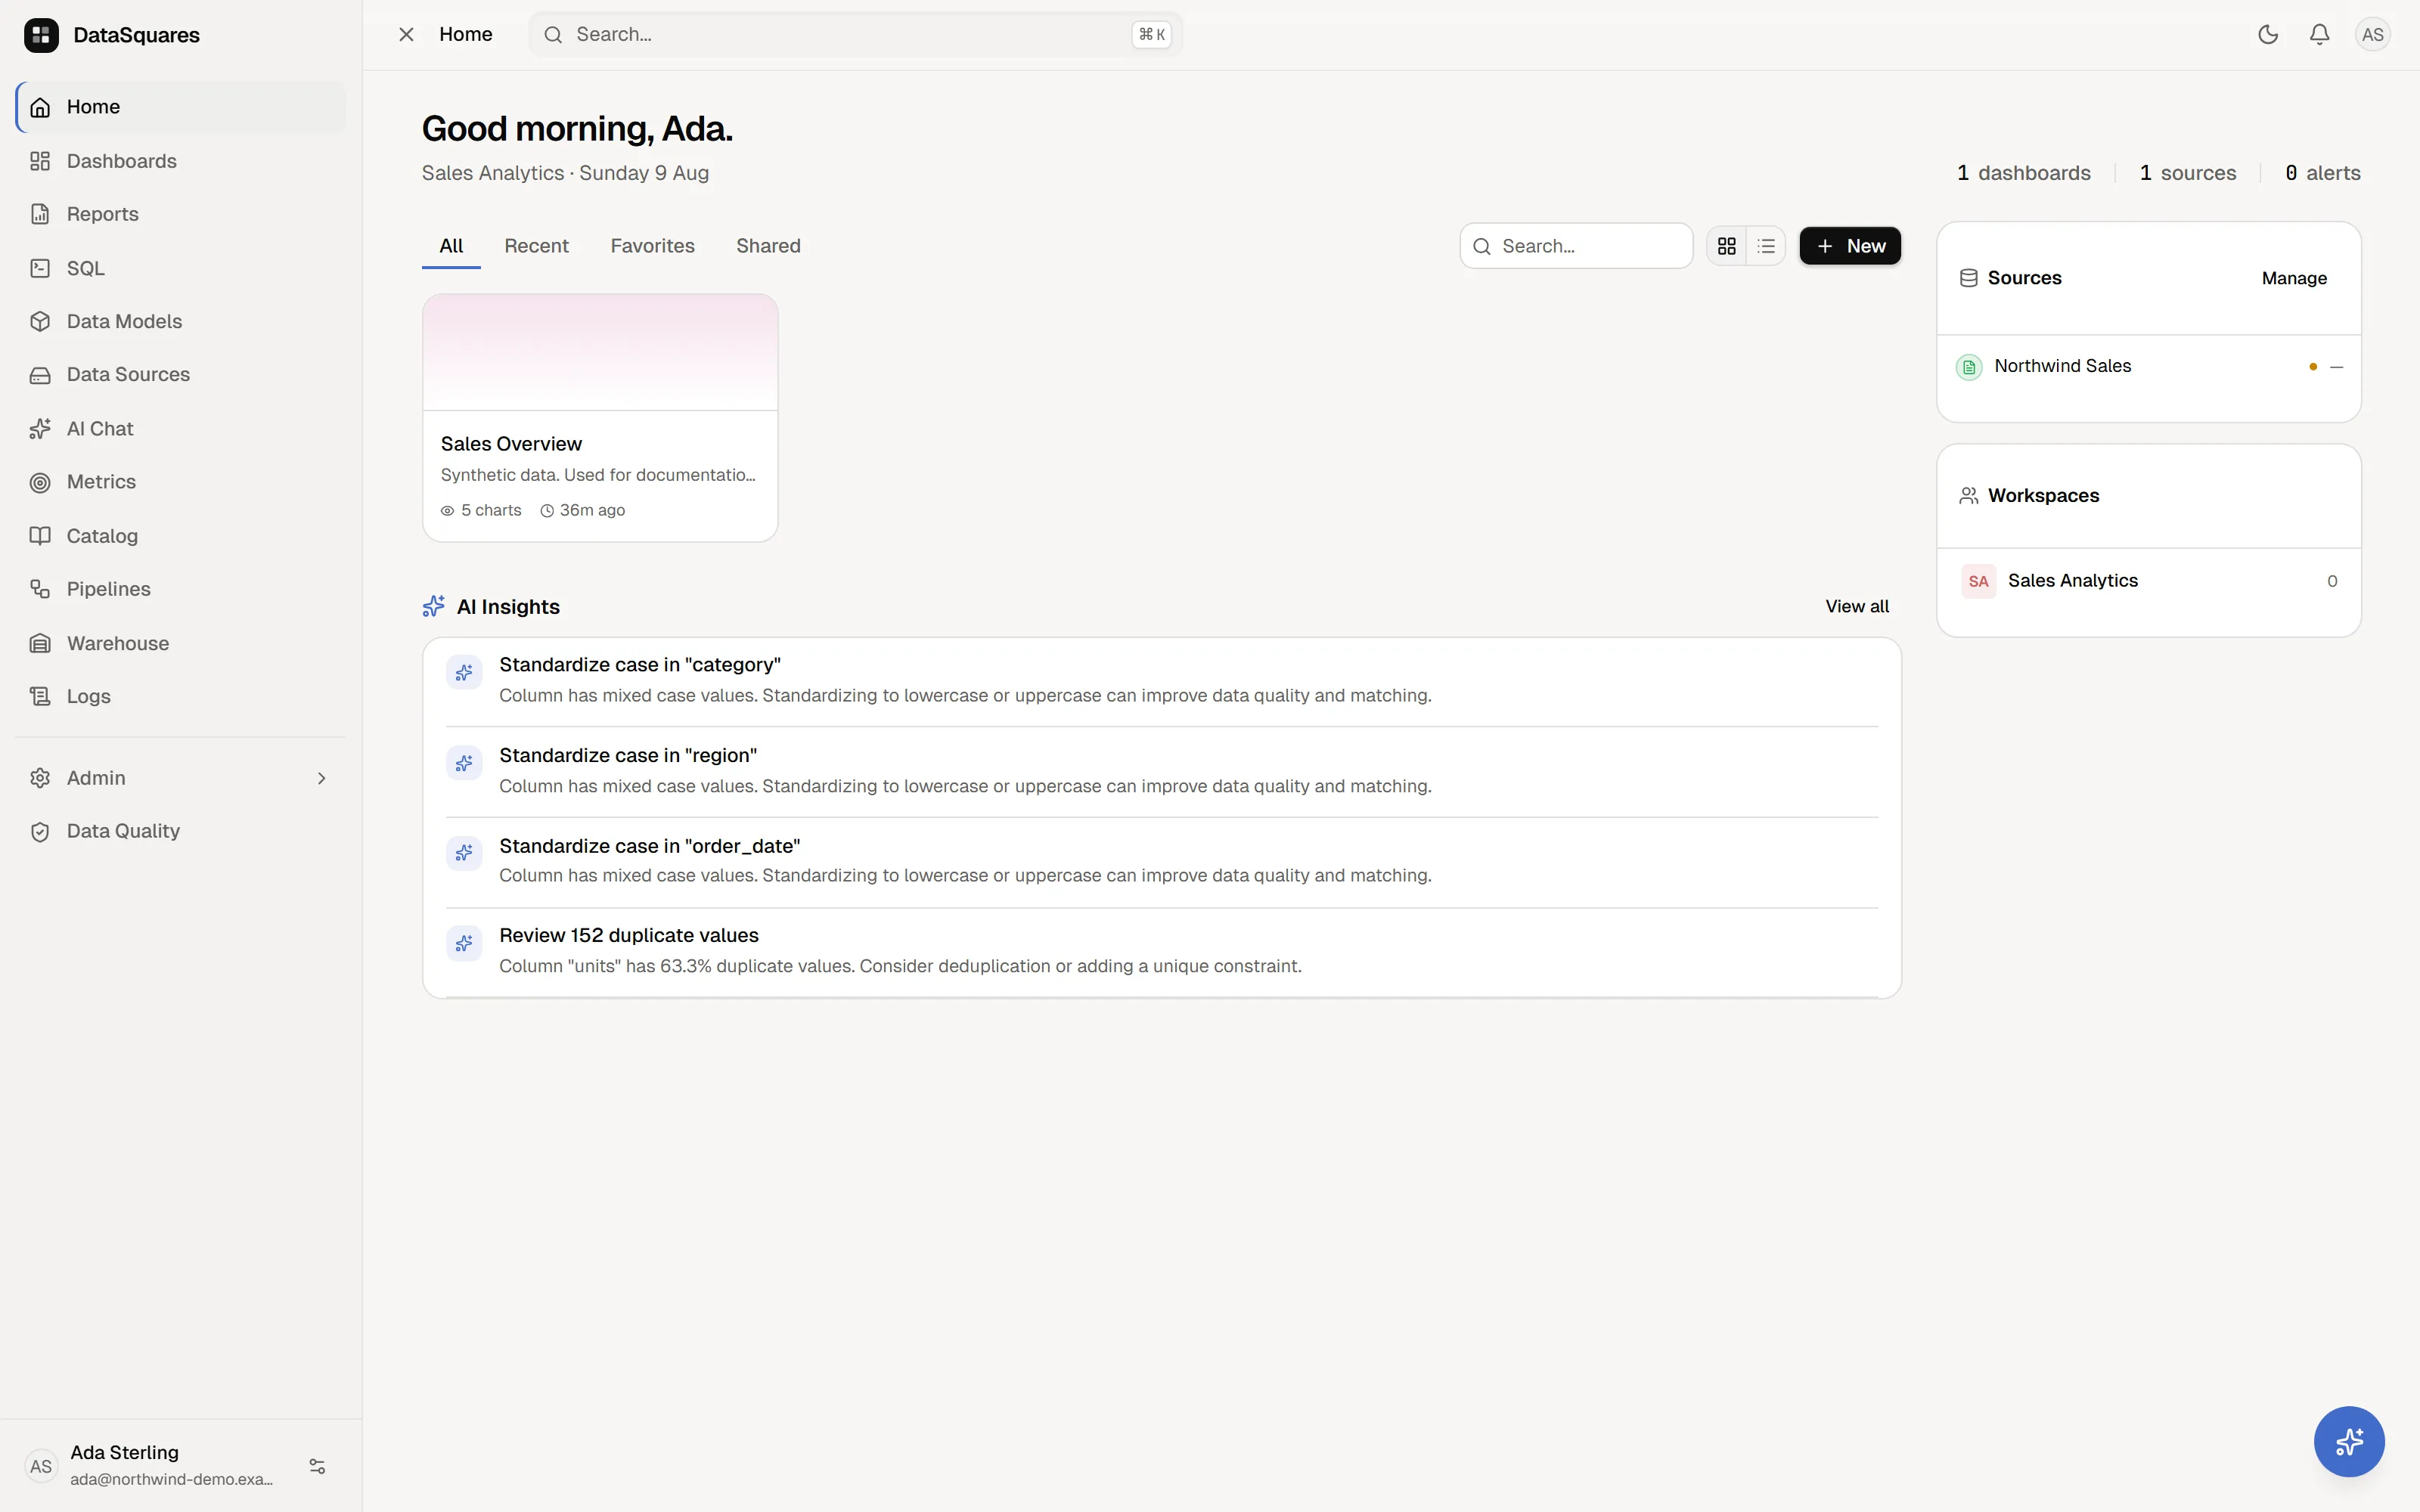
If you have used Power BI, Tableau, or Metabase, you will feel at home — and a few things will feel better.
What you can do with it
Section titled “What you can do with it”Connect your data
Section titled “Connect your data”DataSquares connects to 100+ databases, warehouses, files, and APIs through a guided connection wizard: classic databases (PostgreSQL, MySQL, SQL Server, and many more), cloud warehouses (Snowflake, BigQuery, Databricks, Redshift), file uploads (CSV, Excel), Google Sheets, and REST/JSON APIs. Credentials are encrypted at rest.
Model your data
Section titled “Model your data”Combine tables into data models with relationships, add calculated
fields, and define reusable measures with SquareX — DataSquares’ own
measure language with context-aware calculations (think Calculate, time
intelligence like year-to-date, and level-of-detail expressions). You can author
measures visually with a template builder or write SquareX directly in a code
editor — both edit the same underlying definition.
Build dashboards
Section titled “Build dashboards”A drag-and-drop canvas with a rich set of chart types, filters, cross-filtering and drill-down, copy-paste and format painter, a layers pane, and precise numeric positioning. Dashboards support themes (built-in, custom, and workspace defaults — you can even import a Power BI theme file), small multiples, and per-breakpoint mobile layouts, and present full-screen when it’s time to show your numbers.
Ask your data
Section titled “Ask your data”An AI chat assistant can answer questions against your connected data and an AI generator can draft a dashboard for you to refine.
Share your work
Section titled “Share your work”Share dashboards with teammates, publish view-only share links, embed dashboards in other applications, schedule reports, and export to PDF, PPTX, and PNG with print-quality pagination.
Administer it
Section titled “Administer it”Everything lives in workspaces with member roles and invitations. Single sign-on via OIDC and TOTP multi-factor authentication are supported, and admins control workspace settings such as the default theme.
Where to go next
Section titled “Where to go next”- Follow the Quickstart to build your first dashboard.
- Read Core concepts for the object model — workspaces, sources, models, dashboards, and shares — in one page.
- Explore Early access programs to see preview features (Pipelines, Warehouse, Studio, and Mobile).