Presentations
Bind numbers to data
Every figure on a slide is bound: it reads a metric, a model measure, a field of a model, a saved query or a dashboard card, with the period, comparison and calculation you choose. The deck stores the binding, never the value. Each reader’s figures are computed for them, with their own access, whenever the slide is read — so nothing is pasted, nothing goes stale, and nobody sees a number their access hides.
Numbers in Presentations are the same bound numbers as in Stories: one vocabulary, one way of computing them, one way of writing them.
What a figure can read
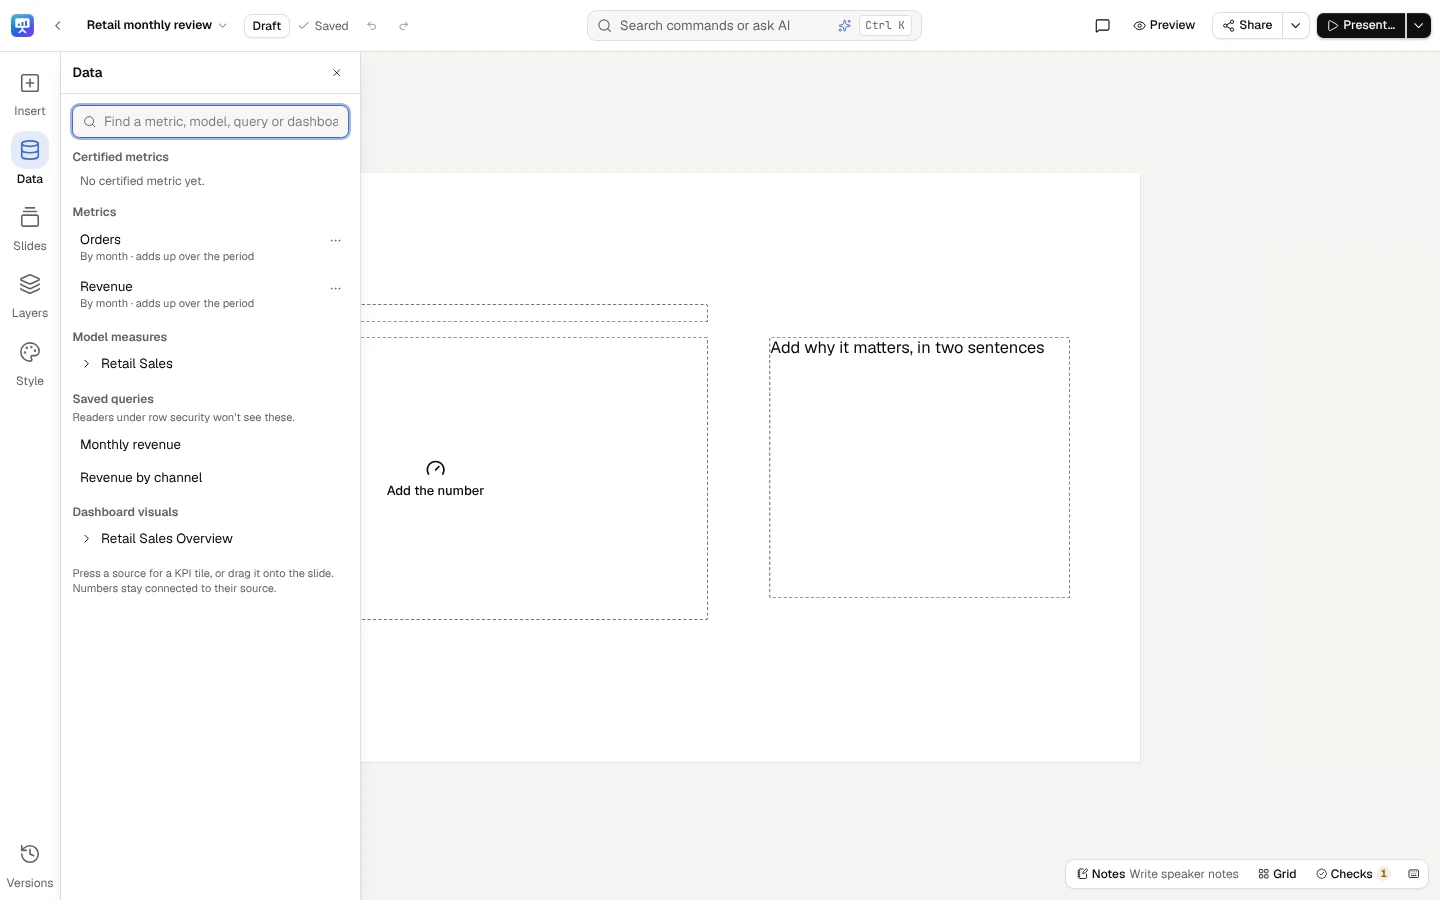
Section titled “What a figure can read”Data, on the rail (its drawer, Add data), lists, in this order:
- Certified metrics, then the other Metrics — governed metrics, with their definition version. On Team, where metrics can’t be certified, Model measures come first and the drawer says Certification comes with Business.
- Model measures — a model, then one of its measures, or A field of the model, summed (or averaged, counted…) (see A field of a model).
- Saved queries — a query’s column, aggregated, chosen from the columns its result returns (see A saved query). Readers under row security won’t see these: a figure from a saved query is withheld from anyone a row-security policy or a sensitive column applies to, as in Stories.
- Dashboard visuals — a dashboard, then one of its cards.
Type in Find a metric, model, query or dashboard to narrow every list.
Put a figure on a slide
Section titled “Put a figure on a slide”- Press a source for a KPI tile, or drag it onto the slide where you want it. A dashboard’s card comes in as a Dashboard visual, drawn as its dashboard draws it (see A dashboard visual).
- A source’s ⋯ menu offers KPI tile, Chart and Table. A chart or a table is broken down by a field: a metric by its time dimension, a saved query by one of its columns; when that isn’t enough to go on, you are asked which.
- While you edit a text box, pressing a source puts a live number where the caret is (Live number in the text in the menu).
- Under a model, A field of the model, summed (or averaged, counted…) opens a small dialog: Insert as (a KPI tile, a chart, a table, or a live number while you edit a text box), then Field, Aggregated as and Periods read on, the same fields as the selection’s panel’s, and for a chart or a table the field it is Broken down by. Nothing is placed until a field is chosen. Choosing a source for an element, it asks the same, without Insert as.
- Insert → KPI tile, Chart or Table opens a dialog: choose A metric (certified ones are marked) or A field of a model, summed (or averaged, counted…) (see A field of a model), and for a chart or a table the field it is Broken down by, the chart type or the top rows to show. A breakdown by a date offers Grouped by: Day, Week, Month, Quarter or Year.
A metric from Add data reads the last complete period of its own grain; one inserted from the dialog reads the last complete quarter, and so does a field of a model with a date to read its periods on, from the dialog or Add data (with none, it reads all of its data); a model measure reads all of its data and a saved query’s column reads every row its query returns. Change any of it in the selection’s panel. Nothing is placed half-bound: what the deck can’t store is refused with the reason.
Data lists what figures can read: certified metrics first, then metrics, model measures, saved queries and dashboard visuals. Find a metric, model, query or dashboard narrows it.
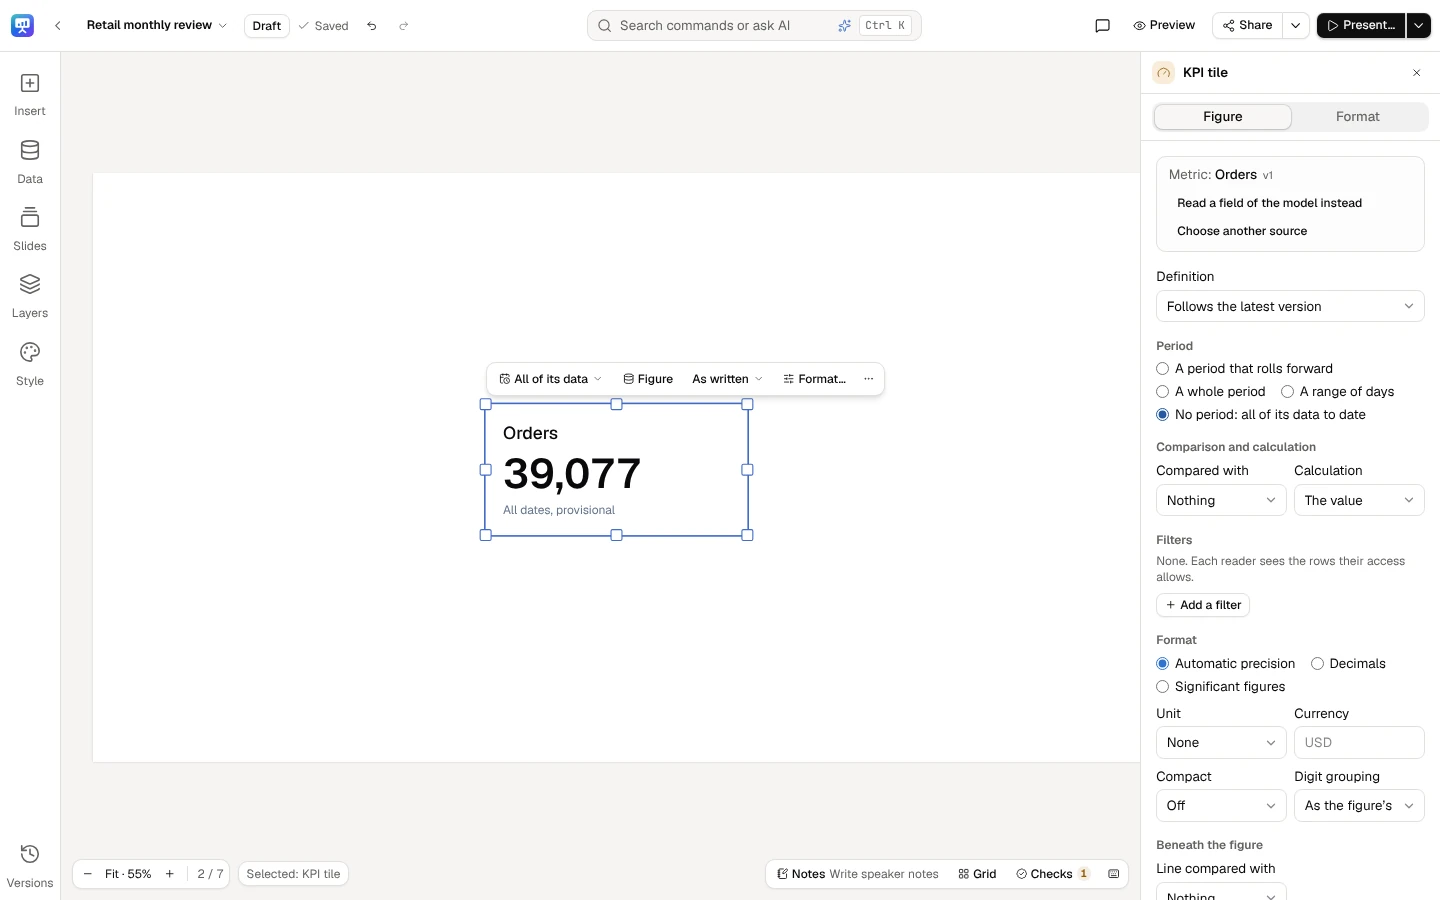
Press a metric for a KPI tile bound to it (or drag it onto the slide). Its Figure tab sets the period, what it is compared with and the calculation.
A field of a model
Section titled “A field of a model”A figure can read a field of a model that it aggregates itself, the way a dashboard card sums, averages or counts a field: Summed, Averaged, Its least value, Its most value, Counted or Counted once each value. It is named for what it is, such as Sum of Amount or Distinct count of Customer, and is never marked Certified: the field belongs to the model, but how it is added up is your choice.
It is read as a metric is, for each reader with their own access: their row security narrows it, and a field with a sensitivity label is a dash, This figure isn’t available with your access, for a reader whose role may not read it. Its period is read on the date you choose in Periods read on; with No date: all of its data it has no period, so it can’t be compared with an earlier one. Its periods, comparisons, calculations, filters, completeness and Data through then behave exactly as a metric’s.
A field of a model is also a live number in a story: the same binding, read the same way. In a story’s number dialog, open a model under Model measures and choose A field of the model, summed (or averaged, counted…), then Field, Aggregated as and Periods read on as in the selection’s panel; a Period is offered once a date is chosen. The number is named as its slide would name it (Count of Amount), and its figure is read once the number is in the text and the section is saved.
A saved query
Section titled “A saved query”Pressing a saved query opens a small dialog. Its columns are listed as its result returns them, read without running the whole query, so nothing is typed by hand: Its values (Added up, Averaged, The smallest, The largest, Counted or The first row’s), the Value column (a column of numbers to add up, average or bound; any column to count or to take the first row’s), for a chart or a table the column its Rows by the column, and Periods read on, a date column of its result. Nothing is placed until a column is chosen. You need to be able to edit the slides and to read saved queries; when its columns are withheld (row security on its source, a column your role may not read), the dialog says why in its own words.
A saved query’s figure is read from its result as a model’s figure is read from its data, wherever that applies to a result set:
- Periods are read on its Periods read on column, as the whole column holds them in the query’s result before any figure’s filters, so every figure on the query reads it alike: a tile filtered to EMEA, the total and a chart by region never disagree. A date is the day it names. A column whose every date and time sits at 00:00 UTC holds days, each the day it names: a query’s own months from a database that works in UTC, or a date kept in a date-and-time column, read as the months and days they name in any time zone, as a report’s KPI reads them. In any other column a date and time is the day it falls on in the deck’s time zone, midnight UTC included (an order at 00:00 UTC on 1 October is 30 September in New York), so a query that buckets by month in a database that works in the deck’s zone reads as that month too. With No date: every row it reads every row and has no period, so it can’t be compared with an earlier one.
- With a period, its Compared with and Calculation are a metric’s: the period before or the same period a year before, a difference, a percent change, a change in points, a growth rate, a share of the whole or a contribution to the whole’s change. Without one, its value or a Share of the whole across one of its columns.
- Filters name its columns. They are wrapped around the query on the columns its result returns, as a report’s filters on a saved-query block are: the query itself is never changed. A filter on a column it doesn’t return is never left out: the figure shows a dash, This figure could not be computed. Links and embeds read it with the filters you set, and nothing a viewer does widens them.
- A chart’s or a table’s groups take the same comparisons and calculations, each group compared with its own earlier figure. A chart over its own Periods read on column shows each period’s value, so it is compared with nothing. A figure taken from one row (Its rows where region = EMEA) groups only those rows in a chart; Read every row takes that away.
- A result larger than the platform reads at once is drawn from the rows it holds, never as could not be computed,
and says so where it is drawn: a KPI tile reads Cut short by a row limit: not every row is counted beneath its
period; a number in a text box is written with an asterisk after it (
$4.82M*) and the slide’s foot says the same words; a chart’s notes read Cut short by a row limit: not every row is drawn. Each is drawn so in the editor, while presenting, in a link or an embed, and in the PDF and the PowerPoint file, and a number’s details and the words said while presenting say it too. The checks flag it (N9) until it is aggregated in the query. A story reads a saved query to the same limit, so a figure carried between a deck and its story is one number.
The figure is withheld from a reader under row security on the query’s source, as before, whatever its filters.
Change a binding
Section titled “Change a binding”Select the element and open its Figure tab. For a text box, the tab lists its live numbers; choose Change on one. The fields are those of Stories’ number dialog:
- Source — what it reads, Certified when it is, and Choose another source (for a dashboard visual, Choose another card). Beside a metric or a model measure, Read a field of the model instead reads a field of the same model; it keeps the date a metric reads its periods on, and nothing changes until you choose the field.
- Field, Aggregated as and Periods read on (a field of a model) — the field, how it is added up, and the date its periods are read on. The Period is offered once a date is chosen.
- Definition (a metric) — Follows the latest version, or Pinned to version 4, the current one.
- Period — A period that rolls forward (the last complete week, month, quarter or year, or one of them to date), A whole period (2026-Q3), A range of days, or No period: all of its data to date. A model measure declares no time dimension, so it reads all of its data; for a period, use the metric built on it.
- Value column, Its values and Periods read on (a saved query) — its column, how it is added up and the date column its periods are read on, from the columns its result returns (see A saved query).
- Compared with and Calculation — the value, a difference, a percent change, a change in points, a growth rate, a share of the whole or a contribution to the whole’s change. A model measure’s single figure is its value or a share; so is a saved query’s without its date column.
- Broken down by (a chart or a table) — a field, Then by another, Add a breakdown. A date offers Grouped by: Day, Week, Month, Quarter or Year, one point or row per period, a period with no data drawn as a gap, never as zero; Each date as it is keeps every date (a metric’s own time dimension is read at the metric’s grain). A chart over the date its figure reads its periods on shows each period’s value, so it is compared with nothing: break it down by another field to compare it. A chart with more than 25 members of a breakdown draws them as a dashboard does: the 20 largest, in their order, and the rest added up as Other, which says what it holds (its members, or how many). The categories of bar, column, stacked bar, 100% stacked bar, lollipop, pie and donut charts are grouped this way, and the series of bar, column, line and area charts, stacked ones included; a treemap, a Pareto chart, a waterfall, a funnel, a heatmap, a map, and a line or an area chart’s categories always show every member. Other is grey as a part of a pie or a donut and as a series; as a bar of a bar, column or lollipop chart it is drawn in the chart’s series colours, as every bar is. Its total is unchanged, and each member keeps its colour whether or not it is in Other. This applies only to a measure that adds up; an average or a ratio, a date and an ordered breakdown always show every member. It applies to the charts decks already hold too, published and frozen ones included, from their next drawing: in the editor, while presenting, for readers, in exports and in schedules. Other is one part, to builds and to the alt text, and an annotation can end on it as on any bar. An annotation that ends on a member now inside Other (a member the data itself names “Other” too) shows a dash, and the chart’s notes and the Data tab say Region 25 is grouped into Other on this chart, which draws its 20 largest categories: pick a category it draws. Pick another end for it.
- Filters on the rows the figure reads (a saved query’s on its columns); each reader’s own row security applies on top.
- Format — precision, unit, currency, compact notation and digit grouping. A deck writes every figure in one locale, so a figure set to another one is refused with the reason.
What can’t be computed honestly is refused in a sentence and nothing is written: a change with nothing to compare with, a share without its filter, a chart with no breakdown. Each change is one step of the slide’s history, so Undo takes it back.
A KPI tile also has the line beneath its figure: compared with Nothing, The period before, The same period a year before or A target, as a Percent change, a Difference or a Change in points. An earlier period needs the figure’s own period. A Target is a number in the figure’s own units, needs no period, and is written once you leave its field; the line then reads ▼ 3.5% vs target $5.00M, the target written in the figure’s format, on the slide, while presenting and in every export.
A dashboard visual
Section titled “A dashboard visual”A Dashboard visual is drawn as its dashboard draws it: from the card’s own chart, query and filters, read for each reader through the dashboard’s own access. On the slide you can move it, resize it or Choose another card; its Format tab, in the selection’s panel, says Drawn as its dashboard draws it.
To change the chart itself, choose Make it an editable chart in its Figure or Format tab, in the selection’s panel. It becomes a KPI tile, a chart or a table bound to the same data, in the visual’s place, size, layer and placeholder:
- the card’s model measure or metric, or the field it sums, averages, counts, counts once each value, or takes the least or the most of itself (a field of a model);
- the fields it is broken down by (its axis, then its colour; a table’s columns), a date grouped by day, week, month, quarter or year as the card groups it — a field of a model then reads its periods on that date;
- the card’s filters, its order and a table’s top rows, and a model measure’s own number format;
- for a metric’s KPI card, the last complete period of the metric’s grain, compared with the period before, as the card shows it.
From then on it has every Format and Data setting (chart type, order, axis, period, comparison, calculation, filters, format), its look is the deck’s, and each reader sees it with their own access, as every bound figure. Undo brings the visual back.
When a visual can’t become an editable chart
Section titled “When a visual can’t become an editable chart”The Figure tab says why in one sentence, for example when the card:
- draws a saved query’s rows as they come;
- computes a value a deck figure doesn’t take: a median, a standard deviation or a variance of a field, a calculated field, a field shown as it is, or a running total or another quick calculation;
- is a chart a deck doesn’t draw (a scatter, combo or gauge chart, a matrix, a map of points);
- shows more than one value;
- splits into small multiples;
- has a filter that moves with the date (last 30 days), matches part of a text, or applies to added-up values;
- is ordered or cut in a way a deck doesn’t keep (only its first 10 rows, its top 5 with the rest put together);
- shows a metric whose latest period is a day, or a KPI that compares periods on its own date.
Keep it as its dashboard draws it, Choose another card, or, if you can edit the dashboard, Change it on its dashboard: the dashboard opens in a new tab. Change the card there (a sum in place of a median, say) and the visual can become an editable chart.
What every figure says about itself
Section titled “What every figure says about itself”- Its period and scope, on the element. A chart, KPI tile or table carries a subtitle generated from its binding: the period with its days and time zone, its filters, and how your access narrowed it — Q3 2026 (Jul–Sep, UTC) · Region = EMEA · EMEA only, your access.
- Its source, on hover. Hover a live number for what it reads and its period, Data through 23 Oct 2026 (or Completeness unknown when its source does not say), provisional while its period is not finished or not settled, the scope of your access and Certified. While presenting, click it or press I for the full source list.
- That it could not refresh. When a figure that was read before can’t be read now, it keeps its last value, marked could not refresh with the time it was computed. A figure never read shows a dash.
What readers see
Section titled “What readers see”Each reader’s figures are computed with their own access: a model-bound figure under their row security and masking. A figure they may not see is a dash, and it says why:
| When | What the reader is told |
|---|---|
| Their access leaves the figure out | This figure isn’t available with your access. |
| It reads a saved query, and the reader is under row security | This figure comes from a saved query, which readers under row security don’t see. |
| What it reads has been removed | What this figure was bound to has been removed. |
| Its source can no longer be read | This figure’s source can no longer be read. |
| It could not be computed | This figure could not be computed. |
A dash never stands for another person’s value or an old one.
Claim words, periods and figures typed by hand
Section titled “Claim words, periods and figures typed by hand”Slides show the other kinds of Stories numbers exactly as Stories does:
- a claim word (grew, fell, held steady) follows its figure for each reader, and shows a dash when the figure can’t be read;
- a period in words (Q3 2026) reads the period it is bound to, and rolls forward with it;
- a figure typed by hand — a plan or an outside estimate — is marked † for every reader, says who entered it and when, and is Entered by hand · not checked against data.
In this release they come into a deck with slides made from a story; the slide editor doesn’t insert new ones yet. A figure typed into slide text as plain digits is not bound: the checks find it (N1). Its Bind this number button, in the Checks panel, takes you to the slide and asks the Data tab for the figure it is; the typed number then becomes a live number of what you choose, where it stands. A deck imported from PowerPoint brings its numbers in this way.
The words the deck’s master writes on every slide are not slide text: a number in its footer (Studio 54) is plain text, the same on every slide, and the checks don’t read it as a figure, as they never read the slide number. The master’s editor says so under the footer’s words.
Related
Section titled “Related”- How the checks work
- Governed metrics — versions, how a metric adds up, when a period is complete
- Stories: live numbers
- Make a deck